
ONONDAGA LAKE AMBIENT MONITORING PROGRAM
2009 ANNUAL REPORT
ONONDAGA COUNTY, NEW YORK
FINAL
NOVEMBER 2010
Prepared for:
ONONDAGA COUNTY DEPARTMENT OF WATER ENVIRONMENT PROTECTON
Syracuse, NY
Prepared by:
|
EcoLogic, LLC
Aquatic, Terrestrial and Wetland Consultants
Cazenovia, NY
Lars Rudstam, Ph.D.
Cornell Biological Field Station
Bridgeport, NY
Anchor
QEA, LLC
Liverpool, NY
|
|
|
|
|
|
|
 A MESSAGE FROM THE COUNTY EXECUTIVE
Onondaga Lake is on the road to recovery.
This report of the 2009 Ambient Monitoring Program carried out by the Onondaga
County Department of Water Environment Protection (DWEP) documents significant
progress toward improving water quality and habitat conditions.
I
encourage all residents of Onondaga
County to read this
report and to take pride in the value of our investment in infrastructure
improvements.
As in 2008, the 2009 AMP annual report is a concise summary of
major findings with links to supporting information. This paperless format was
developed to advance two objectives: first, to reach a broader audience, and
second, to continue to find ways to reduce our environmental footprint, through
our commitment to green initiatives. We are confident that this format will
enable more of our County leaders and citizens to become better informed
regarding the condition of Onondaga
Lake and its watershed.
Additional program information, including annual reports from previous years,
can be found on the County web site www.ongov.net/wep
Joanne C. Mahoney
Onondaga County Executive
_____________________________________________________________________________________
A MESSAGE FROM THE
COMMISSIONER OF WATER ENVIRONMENT PROTECTION
The Department of Water Environment Protection is responsible
for collecting and treating wastewater from homes and businesses throughout the
County. As Commissioner, I am proud to lead our dedicated staff under a name
that reflects Onondaga County’s firm commitment to
protecting the water resources we all share. The Department is required to
complete an intensive survey of water quality conditions in the Onondaga Lake watershed each year. This
publication is a summary of the findings of the 2009 Ambient Monitoring Program
(AMP). 2009 marked the 40th consecutive year that Onondaga County
successfully completed a monitoring program of Onondaga Lake
and adjacent waters. Results of this long-term monitoring effort are used to
track how Onondaga
Lake is responding to
pollution abatement activities. Current conditions and trends in water quality
and the lake’s biological community are highlighted in
this
document. Comments on this report are encouraged and may be directed to Jeanne
C. Powers at 315-435-2260 or email JeannePowers@ongov.net
Patricia M.
Pastella, P.E., BCEE
Commissioner

Key
Features of this Report
This report presents the findings of Onondaga County’s Ambient
Monitoring Program (AMP) for 2009. The County’s annual monitoring program is
designed to evaluate compliance with water quality standards and trends as
improvements to the wastewater collection and treatment infrastructure are
completed. Each year, the Onondaga
County Department of Water Environment Protection collects extensive water
quality and biological data to characterize Onondaga Lake and its
watershed. This summary report of 2009
conditions provides a synopsis of the extensive data to the many stakeholders
interested in Onondaga
Lake.
The 2009 report was prepared and distributed as an electronic
document. Key results and supporting tables and graphics are included in the main
document, with links to supporting tables, technical reports and graphics in an
electronic library. The report and supporting files are available on CD and on
the Onondaga County web site www.ongov.net. Throughout the document, the reader will
find hyperlinks to more detailed tables, graphs and reports. Simple definitions of many of the technical
terms are included (roll the computer mouse over a highlighted term). A folder
icon at the end of each section (illustrated below) provides links to the
section of the electronic library where additional materials are archived.

Once in the library of supporting
documents, the reader can navigate back to the main report using web browser
navigation tools. There are more than
500 supporting tables and graphics in the library of supporting materials.
While each hyperlink has been checked, it is possible that some features may
not be enabled on every computer’s
operating system. Feedback on the functionality of the electronic
features of the document is welcome, please contact JeannePowers@ongov.net with comments.
TABLE OF CONTENTS
Executive Summary
1.
Introduction to the AMP
1.1
Regulatory requirements
1.2 Ambient Monitoring Program Design
1.3 Turning Data into Information: Metrics
1.4 Mathematical modeling
1.5 Timeline of Onondaga Lake and Watershed
Events, 1998-2009
2. Onondaga Lake and its Watershed
3. Tributary
Results: 2009 Water Quality Status and Trends
3.1 Climatic Conditions
3.2 Tributary Water Quality and Annual Loads
Compliance with Ambient Water Quality Standards
Compliance with Metro SPDES Permit
Flows and Loads
Storm Events
Wet and Dry Weather Events
Trends
4. Onondaga Lake: 2009 Water Quality Status
and Trends
4.1 Trophic State Indicator Parameters
Total
Phosphorus (TP)
Chlorophyll-a
Secchi Disk Transparency
Trophic State Index
4.2 Ammonia and Nitrite
4.3 Recreational Quality
4.4 Metro Improvements and Lake Response
4.5 Seneca
River
5. Biology and Food Web: 2009 Results and
Trends
5.1
Phytoplankton
5.2
Macrophytes
5.3
Zooplankton
5.4 Zebra and Quagga Mussels
5.5 Fish
Richness and Diversity
Reproductive Success
Recreational Fishery
Abnormalities
6. Integrated Assessment of the Food Web
7. Progress with Related Initiatives
8. Emerging Issues and Recommendations
9. Literature
Cited
LINK TO LIBRARY FILES
LIST
OF TABLES AND FIGURES BY SECTION
EXECUTIVE SUMMARY
Table EX-1 Summary
of Metrics, Onondaga Lake 2009.
SECTION 1: Introduction to
the AMP
Table 1-1. Summary of Current Fish Consumption
Advisories for Onondaga Lake.
Table 1-2 Metro
Compliance Schedule.
Table 1-3 CSO
Compliance Schedule.
Table 1-4 Data Analysis and Interpretation Plan.
Table 1-5 Summary
of metrics used to evaluate progress toward improvement.
Figure 1-1 Tributary
and Lake Regulatory Classification and Subwatershed Boundaries.
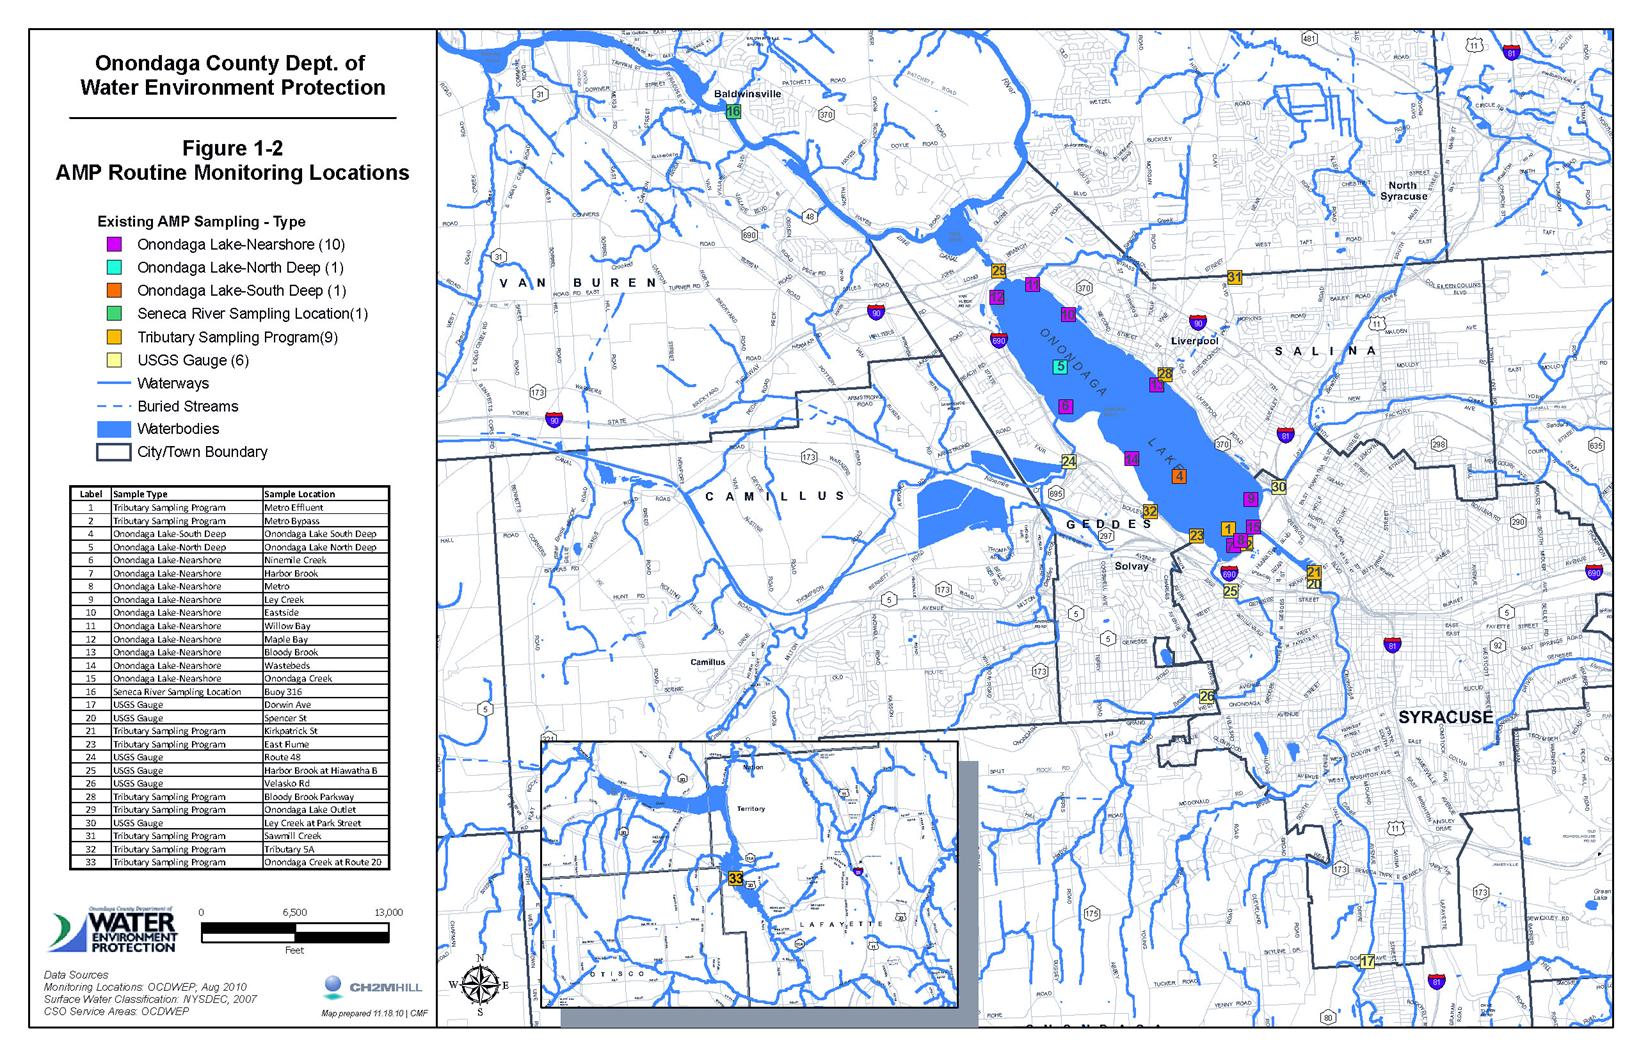
Figure 1-2 Map
of monitoring locations, Onondaga Lake and tributaries.
SECTION 2: Onondaga Lake
and its Watershed
Table 2-1 Morphometric
characteristics of Onondaga Lake.
Figure 2-1 Hydrologic
input to Onondaga Lake, as percent of total.
Figure 2-2 Land Cover Classes, 2001, Onondaga Lake
Watershed.
SECTION
3: Tributary Results: 2009 Results and Trends
Table 3-1 Percent
of Onondaga Lake tributary sample results in compliance with NYS water quality
standards, 2009.
Table 3-2 Flow-weighted
average concentration of selected parameters, 2009, Onondaga Lake tributaries.
Table 3-3 Annual loading of selected water quality
parameters to Onondaga Lake, 2009.
Table 3-4 Percent annual loading contribution by
gauged inflow, 2009.
Table 3-5 Tributary and Metro Total Phosphorus (TP)
Loading to Onondaga Lake, pre-ACJ and post-ActiFlo implementation.
Table 3-6 Tributary and Metro Soluble Reactive
Phosphorus (SRP) Loading to Onondaga Lake, pre-ACJ and post-ActiFlo
implementation.
Figure 3-1 Metro
NH3-N, monthly average discharge compared to permit limit.
Figure 3-2 Metro
effluent compliance for total phosphorus concentration, 12-month rolling
average.
Figure 3-3 Metro
and Tributary Sources of TP to Onondaga Lake, 1998 to 2009.
Figure 3-4 Metro
and Tributary Sources of SRP to Onondaga Lake, 1998 to 2009.
Figure 3-5 Total
phosphorus external loading to Onondaga Lake (Water Year) compared with South
Deep total phosphorus concentrations (summer) in upper waters.
Figure 3-6 Metro
Loading of Ammonia, Nitrite, Nitrate and Organic Nitrogen, 1998‐2009.
Figure 3-7 Onondaga
Lake Ammonia Sources, 1998 and 2009.
SECTION 4: Onondaga Lake:
2009 Status and Trends
Table 4-1 Percent
of Ammonia Measurements in Compliance with Ambient Water Quality Standards,
Onondaga Lake, 1998-2009.
Table 4-2 Nearshore
Secchi disk transparency statistical summary for Onondaga Lake, 2009.
Figure 4-1 Onondaga
Lake Summer Average Total P Concentration (0‐3m), 1998‐2009.
Figure 4-2 Onondaga
Lake Summer Algal Bloom Frequency, 1998‐2009.
Figure 4-3 Onondaga
Lake Chlorophyll‐a
Concentration, 1998-2009.
Figure 4-4 TP
and Chlorophyll-a concentrations,
Onondaga Lake 2007-2009 compared with Oneida and Finger Lakes.
Figure 4-5 Onondaga
Lake Secchi Disk Transparency, January‐December, 2009.
Figure 4-6 Carlson
Trophic State Index (TSI) Onondaga Lake, 1998- 2009.
Figure 4-7 Onondaga
Lake Fecal Coliform Bacteria Abundance, Summer Geometric Mean, 1999‐2009.
Figure 4-8 Onondaga
Lake Fecal Coliform Bacteria Compliance, April – October 2009.
Figure 4-9 Relationship
between TP Loading (all sources) and Onondaga Lake TP Concentration, 1990‐2009.
Figure 4-10 Nitrogen:
Phosphorus Ratio, 1998‐2009.
Figure 4‐11 Onondaga Lake Minimum DO in upper waters (0-3m)
during fall mixing period, 1998‐2009.
Figure 4-12 Comparison of soluble reactive phosphorus (SRP)
and nitrate-N concentrations with dissolved oxygen concentrations in South Deep
lower waters of Onondaga Lake during 2009.
Figure 4-13 Three
Rivers System Study Area.
SECTION 5: Biology and
Food Web: 2009 Results and Trends
Table 5-1 2009
Macrophyte Field Survey Results.
Table 5-2 List of Fish Species Identified in Onondaga
Lake, 2009
Figure 5-1 Reduction
in Onondaga Lake phytoplankton standing crop, 1998 - 2009.
Figure 5-2 2009
Proportional biomass of phytoplankton divisions in Onondaga Lake.
Figure 5-3 Onondaga
Lake Phytoplankton Community Structure and Biomass, February-December 2009.
Figure 5-4 Onondaga
Lake South Deep, comparison of diatoms and silica concentrations in 2009.
Figure 5-5 Average
biomass of zooplankton, proportion of major groups across time.
Figure 5-6 Biomass
of different Daphnia species in Onondaga Lake.
Figure 5-7 Time
trends in average size of all crustaceans from 1999 to 2009 in Onondaga Lake.
Figure 5-8 Average
crustacean zooplankton length (mm) in Onondaga Lake in 2009.
Figure 5-9 Onondaga
Lake Dreissenid Mussel Average Density and Biomass with Standard Deviation,
2002-2009.
Figure 5-10 Onondaga
Lake Relative Abundance of Dreissenid Mussels, 2002-2009.
Figure 5-11 Comparison of DELTFM for all fish evaluated
with brown bullhead only.
SECTION 6: Integrated
Assessment of the Food Web
Figure 6-1 Food web effects on water clarity
SECTION 7: Progress with
Related Initiatives
No
figures or tables
SECTION 8: Emerging
Issues and Recommendations
No
figures or tables
SECTION 9: Literature
Cited
List of Acronyms

Executive
Summary
The 2009 Annual Report of
Onondaga County’s Ambient Monitoring
Program (AMP) provides an overview of the
results of the extensive monitoring effort underway to characterize Onondaga Lake and its watershed. Conducted annually since 1970,
the AMP represents an unparalleled investment in long-term monitoring of a
complex aquatic ecosystem.
In 1998, an Amended Consent Judgment (ACJ) between Onondaga County, New York
State and Atlantic States Legal Foundation was signed to resolve a lawsuit
filed against Onondaga
County for violations of
the Clean Water Act. The lawsuit alleged that discharges from the Metropolitan
Syracuse Wastewater Treatment Plant (Metro) exceeded the facility’s permitted discharge limits,
and that overflows from the combined
sewer system (CSOs) were not in compliance with state and federal
requirements. The ACJ obligates the
County to undertake a phased program of wastewater collection and treatment
improvements, monitor water quality response, and report annually on progress
towards compliance. This annual report fulfills the requirement for monitoring
and reporting. The ACJ has been amended four times since 1998 to reflect
changes in regulations, technology and environmental conditions, most recently
by stipulation
in November 2009. Among other
requirements, the November 2009 amendment extends the schedule of required
infrastructure improvements and monitoring through the year 2018.
The AMP is designed to document the lake’s response to
pollution control measures. Samples are collected throughout the entire
watershed to identify sources of materials (nutrients, sediment, bacteria and
chemicals) to the lake. An intensive in-lake monitoring program examines water
quality conditions and the interactions between Onondaga
Lake and the Seneca River.
Data are evaluated for compliance with water
quality standards
and analyzed for trends. In addition to
the water quality monitoring effort, the AMP examines the nature of the lake
ecosystem by characterizing the species composition and abundance of fish,
phytoplankton, zooplankton, benthic invertebrates, aquatic plants and
dreissenid (zebra and quagga) mussels.
Excessive
discharges of municipal and industrial wastewaters, structural modifications
resulting in altered water levels, loss of wetlands, and runoff from urban and
rural areas have degraded the quality of Onondaga Lake. Contact recreation has been precluded by
elevated bacteria counts, algal blooms from excessive phosphorus and poor water
clarity. Conditions for aquatic life
were compromised by high ammonia and nitrite concentrations, low dissolved
oxygen levels, and lack of habitat. Onondaga Lake’s degraded water quality
resulted from multiple sources of pollution. Increasingly stringent regulations
and major investments by the public and private sectors have reduced the
pollutant inputs to Onondaga
Lake, resulting in
improved water quality and habitat conditions.
In
light of the lake’s
water quality conditions, the primary focus of
the improvements to the wastewater treatment system has been to provide a
higher level of treatment for ammonia and phosphorus at Metro. Two new
treatment systems have been brought on line to reduce Metro’s discharge of
ammonia and phosphorus to Onondaga
Lake. The Biological
Aerated Filter (BAF) system has resulted in year-round nitrification
(conversion of ammonia to nitrate) of the wastewater. This innovative
technology, which became fully operational in 2004, has resulted in a 98%
decrease in Metro’s
ammonia loading to the lake. Phosphorus removal is achieved using a physical-chemical High-Rate Flocculated
Settling (HRFS) technology, known as Actiflo. The system came on line in 2005
to meet an interim effluent limit of 0.12 mg/L of total phosphorus. This technology has resulted in an 86%
decrease in Metro’s
total phosphorus loading to the lake. As part of the November 2009, fourth
stipulation to the ACJ, the total phosphorus discharge limit from
Metro will be revised downward to 0.10 mg/L, effective in November, 2010. In
addition to these improvements focused on ammonia and phosphorus, the
technology employed for disinfecting Metro effluent has been upgraded from
chlorination/dechlorination to an ultraviolet disinfection system.
The
2009 results document the continued significant improvements in Onondaga Lake brought about by these reductions
in ammonia and phosphorus inputs from Metro. Water quality has improved
dramatically; nutrient levels are reduced and dissolved oxygen has increased.
No algal blooms were evident; the lake water was generally clear and
aesthetically appealing. Total phosphorus concentrations averaged 17 µg/L over
the summer of 2009 in the lake’s upper waters, comparable to conditions in nearby Oneida Lake and several of the Finger
Lakes. The summer of 2009 marks the second consecutive year that
the total P concentration in Onondaga Lake waters has complied with the state’s guidance value
of 20 µg/L, which was established to protect recreational uses and drinking
water supply. Bacteria counts in the Class B segment of the lake shoreline
remained within limits set for water contact recreation. Ammonia N concentrations have been in full
compliance with NYS standards in the lake’s upper waters since 2004, and at all
water depths since 2007.
Clearer
water allows light to penetrate deeper into the lake, and fosters the
proliferation of macrophytes (rooted aquatic plants and bottom-dwelling algae)
in nearshore shallow waters, to a water depth of six meters. The macrophyte community has also become
more diverse, as more species of plants have colonized the nearshore waters of
the lake. As these macrophyte beds have
spread around the perimeter of the lake, they have brought improved habitat
conditions. The populations of gamefish
such as largemouth and smallmouth bass have increased steadily since 2000.
The
2009 report highlights an expanded review of the lake’s fish community, tracking
changes over a full decade of AMP biological
monitoring (2000 –
2009). Overall, there has been an increase in
the quantity and quality of habitat, both littoral and pelagic, available to fish species. This has resulted in a slight increase in the
number of species present and a more even distribution of fish throughout the
lake. Many fish species, particularly
those associated with vegetated habitats, are also increasing in
abundance. The aquatic food web within
the lake continues to include new species, both native and non-indigenous
(exotic), with increasingly complex pathways of material and energy transfer
among the life stages of the biota. This increasing complexity with regard to
energy sources and energy flow results in an ecosystem that may be more
resilient to environmental stress. The
results of the 2009 AMP indicate that this is an ongoing process and that more
changes are likely to occur. As lake
water quality continues to improve, resulting in more diverse and higher
quality habitat conditions, increases in aquatic species diversity, abundance, and interrelatedness can also be expected.
Segments
of streams flowing into Onondaga
Lake also exhibit
degraded water quality and habitat conditions. The ACJ has required investment
in improvements to the wastewater collection infrastructure as well as at
Metro. These improvements are improving water quality and habitat conditions in
segments of the lake tributaries affected by combined sewer overflows. Four
strategies have been employed to eliminate wet weather discharges from the
combined sewer system; these methods include separating sewers, constructing
regional treatment facilities, capturing floatable materials and maximizing
system storage capacity. During 2009, County facilities and other urban areas
began to implement green infrastructure solutions to help manage urban storm
runoff. Green infrastructure encourages infiltration, capture and reuse of
storm runoff before it enters the sewer system. By preventing storm water
runoff from entering the combined sewers, more capacity is available for
sanitary sewage flow to reach Metro for treatment. The fourth stipulation
includes specific requirements and milestone dates for capturing an increasing
percentage of the annual stormwater volume. A “Save the Rain” initiative is
underway to educate watershed residents about ways to capture and use rain water.
Water
quality conditions in the Seneca
River during 2009 were
comparable to those measured in previous years. Although the proliferation of
dreissenid mussels continues to affect water quality conditions, relatively
high stream flows during the summer of 2009 prevented prolonged conditions of
low dissolved oxygen. Ammonia and nitrite concentrations in the monitored
segments of the Seneca
River were in compliance
during 2009.
Onondaga County Department
of Water Environment Protection, in consultation with NYSDEC and the Onondaga
Lake Technical Advisory Group, has developed a suite of metrics to help organize and report on the extensive AMP
data set each year. These metrics relate to the lake’s designated “best use”
for water contact recreation, fishing and protection of aquatic life. The 2009
results (Table EX-1) document substantial progress toward attaining the
designated uses in Onondaga
Lake.
|
Table EX-1. Summary of 2009 Onondaga Lake Conditions.
|
|
Restoration
Goal
|
Measured
By
|
2009
Results
|
Significance
|
|
Suitability for Water Contact
Recreation
|
|
Indicator bacteria
|
Fecal colilform bacteria abundance
|
Met NYSDEC standards for water
contact recreation in Class B segments (200 cfu/ 100 mL, geometric mean of at
least 5 samples/month)
|
Class B segments of the lake
exhibit water clarity and bacteria levels that would support swimming,
boating, waterskiing and other types of contact recreation. Class C segments
of the lake, which are close to the major tributaries, periodically exhibit
elevated bacteria and reduced water clarity conditions after storms.
|
|
Water clarity
|
Secchi disk transparency
(nearshore stations)
|
Met NYS Dept. of Health swimming
safety guidance value (1.2 m water clarity) for water contact recreation in
Class B segments
|
|
Aesthetic Appeal
|
|
Water clarity
|
Secchi disk transparency
(mid-lake station)
|
Average June – Sept Secchi disk,
South Deep (mid-lake station): 3.2 m
|
Total
phosphorus (total P) concentration in the lake’s upper waters during summer
(June- Sept) 2009 was 17 ug/L, within the NYSDEC guidance value of 20 ug/L
established to protect the aesthetic quality of lakes and ensure their
suitability for recreational use.
The
low total P resulted in low algal abundance and clear water. The lake was
free of nuisance algal blooms, and cyanobacteria abundance was very low.
|
|
Algal blooms
|
Chlorophyll-a
Total phosphorus in the upper
waters, June – Sept
|
June
– Sept chlorophyll-a @ South Deep
(mid-lake station): 5.9 ug/L
Low
algal abundance throughout the entire recreational period, no blooms
Summer average TP:
17 ug/L
|
|
Algal community
structure
|
Abundance of cyanobacteria
(blue-green algae)
|
<1% of the algal community
was comprised of cyanobacteria
|
|
Aquatic Life Protection
|
|
Ammonia
|
Measured in-lake concentrations,
year-round, all depths
|
100% of measurements met NYS
standards, all depths
|
The 2009 water quality
conditions fully support a diverse warm water aquatic biota. Prior to the ACJ
improvements to the wastewater collection and treatment system, elevated
concentrations of ammonia and nitrite N, and low concentrations of DO during
fall mixing, were measured in Onondaga Lake. These water quality parameters
are now in full compliance with ambient water quality standards established
to protect even the most sensitive species and life stages.
|
|
Nitrite
|
Measured in-lake concentrations,
year-round, all depths
|
100% of measurements met NYS
standards, all depths
|
|
Dissolved oxygen (DO)
|
In-situ buoys and frequent field
profiles during fall mixing (turnover), when historically conditions in Onondaga Lake have been most stressful to
aquatic life
|
7.2 mg/L average DO during fall
mixing, minimum 6.9 mg/L
|
|
Sustainable Recreational Fishery
|
|
Habitat quality
|
Cover and density of aquatic
plants (macrophytes)
Deep water dissolved oxygen
during stratified period
|
Approximately 50% of the
littoral zone exhibited dense macrophyte growth.
The littoral zone is defined as the nearshore
area where light reaches the sediment surface and is thus suitable for the
growth of rooted aquatic plants.
Summer anoxia in hypolimnion
|
Coverage in this range provides
high quality habitat for fish reproduction and rearing; current conditions
are near-optimal for smallmouth and largemouth bass.
Lack of well-oxygenated cold
water limits habitat for resident cold water fish community.
|
|
Fish reproduction
|
Reproduction of target species:
· bass and sunfish
· yellow perch
· black crappie
· rock bass
· walleye and northern pike
|
Occurring:
· bass and sunfish
· yellow perch
· rock bass
No evidence:
· black crappie
· walleye
· northern pike
|
Fish reproduction for several
target species has not been observed in the lake. Adult populations of these
species are stable and, in some cases, increasing. The lack of suitable
spawning habitat, not water quality, appears to be the limiting factor in
fish reproduction in the lake. Restoration of habitat is underway as part of
the Honeywell lake cleanup project.
|
|
Fish community structure
|
Percent of fish species
intolerant or moderately intolerant of pollution
|
4%
|
Most of the Onondaga Lake
fishes are warm water species, and are relatively tolerant of pollution.
Consequently, the percentage of fish species intolerant or moderately
intolerant of pollution is unlikely to exhibit a large increase in the
future.
|

1. Introduction to the AMP
1.1 Regulatory
Requirements
The 2009 Annual AMP report has been prepared and submitted
to the New York State Department of Environmental Conservation (NYSDEC) to
comply with a judicial requirement set forth in the 1998 Amended Consent
Judgment (ACJ) between Onondaga County,
New York State and Atlantic
States Legal Foundation. The ACJ, signed in 1998, has been modified four times,
most recently by stipulation in November 2009. The ACJ
requires a series of improvements to the County wastewater collection and
treatment infrastructure, and an extensive monitoring program to document the
improvements achieved by these measures. Onondaga County Department of Water
Environment Protection monitors the quality of Onondaga
Lake, the lake tributaries, and a
segment of the Seneca
River as part of the
Ambient Monitoring Program (AMP); the program is focused on evaluating
compliance with ambient water quality standards, the nature of the aquatic
habitat, and trends toward improvement.
The NYSDEC is responsible for managing water resources
throughout NY State. As part of this responsibility, NYSDEC classifies surface
waters, including lakes, rivers, streams, embayments, estuaries and groundwater
with respect to their best use.
Monitoring results are evaluated on a regular basis to determine whether
designated uses are supported, and if not, the factors precluding use
attainment. Onondaga
Lake was included on the
state’s inaugural listing of impaired waters in 1998 due to its elevated levels
of ammonia, phosphorus and bacteria, and for its low concentrations of
dissolved oxygen (DO) in the upper waters during fall mixing. The NYSDEC most
recent listing of impaired waters includes several
segments of tributaries to Onondaga
Lake. Waterbodies are
placed on this list when there is evidence that water quality conditions are
not in compliance with applicable standards, and/or the water bodies do not
support their designated use.
Water flows to Onondaga
Lake from a large land
area drained by multiple tributaries, as illustrated in Figure 1-1. Several
outfalls of treated municipal and industrial wastewater and stormwater also
flow into the lake; Tributary 5A and the East Flume flow into Onondaga Lake
along its western shoreline, and Metro effluent enters the lake at the southern
shoreline. The locations of these three inflows are shown in Figure 1-2.
Onondaga
Lake and its tributaries are
currently classified to include Class B and Class C waters. The best usages of Class B waters are primary and
secondary water contact recreation and fishing. Primary water contact
recreation includes activities that immerse the body in the water, such as
swimming; secondary water contact recreation includes activities without full
immersion, such as boating. In addition, Class B waters shall be suitable for
fish, shellfish, and wildlife propagation and survival. The best usage of Class
C waters is fishing. These waters shall also be suitable for fish, shellfish and
wildlife propagation and survival. Class C waters shall be suitable for primary
and secondary water contact recreation, although other factors may limit the
use for these purposes.
For many years, Onondaga Lake did not support its designated uses
due to excessive discharges of municipal and industrial wastewaters and
uncontrolled storm water runoff. Swimming was banned in 1940 due to elevated
bacteria counts and poor water clarity.
Conditions for aquatic life were compromised by high ammonia concentrations
and low dissolved oxygen. Fishing was
banned in Onondaga
Lake in 1972 because of
mercury contamination. The ban was lifted in 1986 and modified into a “catch
and release fishery”; that is, recreational fishing was permitted but
possession of lake fishes was not. Further modifications to the fish
consumption advisories and regulations have occurred over the years, and there
is no longer a blanket restriction on possession of all fish. The current advisory sets forth consumption limits on specific species, and
includes the warning that women under age 50 and children under age 15 should
not consume fish from Onondaga
Lake. Everyone else is advised to eat no walleye of any size, nor largemouth or smallmouth
bass over 15 inches. New in 2010 is the advisory to not eat any carp, channel
catfish or white perch from Onondaga
Lake. The specific advisory for Onondaga Lake
also applies to tributaries and connected waters if there are no barriers to
passage, such as dams or falls.
|
Table
1-1. Summary of Current Fish Consumption Advisories for
Onondaga Lake.
|
|
Lake
|
Species
|
Advisory
|
Chemicals
of Concern
|
|
Onondaga Lake
|
Largemouth
bass and smallmouth bass over 15" and walleye
|
Don't eat
|
Mercury,
PCBs
|
|
Carp,
channel catfish and white perch
|
Don't eat
|
PCBs,
Mercury, Dioxin
|
|
All
fish not listed
|
Eat
up to one meal per month
|
Mercury,
PCBs
|
|
Brown
bullhead and pumpkinseed
|
Eat
up to four meals per month
|
Mercury,
PCBs
|
Some areas of Syracuse
are served by combined
sewer systems which carry both
sewage and storm water in a single pipe. These pipes can overflow during
periods of heavy rain and snowmelt, allowing a mixture of stormwater and
untreated sewage to flow into creeks and ultimately reach Onondaga Lake.
The sewer system was originally designed to overflow to prevent sewage from
backing up into streets and basements, thereby protecting public health. The
combined sewer overflows (CSOs) direct bacteria, floating trash, organic
material, nutrients and solid materials to the waterways.
A comprehensive program to address
the sources of pollution that preclude attainment of the designated uses is
underway. Onondaga County, New York State Department of Environmental
Conservation (NYSDEC) and Atlantic States Legal Foundation entered into the
1998 Amended Consent Judgment (ACJ) to resolve a lawsuit filed against Onondaga
County alleging violations of the Clean Water Act; namely, that discharges from
the Syracuse Metropolitan Wastewater Treatment Plant (Metro) were in violation
of the facility’s discharge permit, and the combined sewer overflows (CSOs) did
not comply with state and federal regulations.
The ACJ has been modified over the years to respond to new technologies
and actual water quality conditions. As of 2010, the County is required to
undertake a phased program of wastewater collection and treatment improvements
extending through 2018 (Tables 1-1 and 1-2).
|
Table 1-2 Metro
Compliance Schedule.
(ppd = pounds per day; mg/L = milligrams per liter)
|
|
Parameter
|
SPDES Limit
|
Effective Date
|
Achieved Date
|
|
Ammonia
|
Stage I :
8,700
ppd (7/1-9/30)
13,100
ppd (10/1-6/30)
|
January 1998
|
January 1998
|
|
|
Stage II:
2 mg/L (6/1-10/31)
4 mg/L (11/1-5/31)
|
May 2004
|
February 2004
|
|
|
Stage III:
1.2 mg/L (6/1-10/31)
2.4 mg/L (11/1-5/31)
|
December 2012
|
February 2004
|
|
Total
Phosphorus
|
Stage I :
400
ppd
(12-month
rolling average)
|
January 1998
|
January 1998
|
|
|
Stage II:
0.12 mg/L
(12-month rolling average)
|
April 2006
|
April 2006
|
|
|
Revised Interim Stage II:
0.10 mg/L
(12-month rolling average)
|
November 2010
|
Pending
|
|
|
Stage III:
0.020 mg/L
(or as modified by TMDL)
|
December 2015
(or as modified
by TMDL)
|
Pending
|
|
Table
1-3. CSO Compliance
Schedule.
|
|
Project Phase
|
Goal
|
Effective Date
|
|
Stage
I
|
Capture for treatment or
eliminate 89.5% of combined sewage* during precipitation, within the meaning of EPA’s
National CSO Control Policy
|
Dec 31, 2013
|
|
Stage
II
|
Capture for treatment or
eliminate 91.4% of combined sewage during precipitation, within the meaning of EPA’s
National CSO Control Policy
|
Dec 31, 2015
|
|
Stage
III
|
Capture for treatment or
eliminate 93% of combined sewage during precipitation within the meaning of EPA’s
National CSO Control Policy
|
Dec 31, 2016
|
|
Stage
IV
|
Capture for treatment or
eliminate 95% of combined sewage during precipitation within the meaning of EPA’s
National CSO Control Policy
|
Dec 31, 2018
|
|
*on a system-wide annual average basis
(per
fourth stipulation to ACJ, Nov. 2009)
|
There are three elements to the ACJ: (1) improvements to Metro, primarily
to reduce phosphorus and ammonia loading, (2) improvements to the wastewater
collection infrastructure to reduce combined sewer overflows (CSOs); and (3)
monitoring the surface waters to evaluate the effectiveness of the improvements
to the wastewater collection and treatment system. Onondaga County
has designed the AMP to provide the data and information needed to document the effectiveness of the controls on
the municipal pollution sources. NYSDEC reviews and approves the annual AMP work plan, participates in technical work group meetings and
reviews and approves the annual report.
The industrial pollution
impacts are also being addressed; projects to intercept and treat contaminated groundwater, remove contaminated
sediments and restore habitat are underway. This effort is spearheaded by
Honeywell International with oversight by state and federal officials. A detailed description of the
Honeywell remedial projects planned for the Onondaga Lake
watershed is on the NYSDEC web site http://www.dec.ny.gov/chemical/48828.html.
1.2 Ambient Monitoring Program Design
The AMP is designed to
identify sources of materials (nutrients, sediment, bacteria and chemicals) to
the lake, evaluate in-lake water quality conditions, and examine the
interactions between Onondaga Lake and the Seneca River.
Representative samples are collected by trained field technicians from a
network of permanent sampling locations along the lake tributaries, nearshore
and deep stations in Onondaga Lake, and along the Seneca River
(Figure 1-2). Data are evaluated with respect to compliance with water quality
standards and trends.
In addition to the water quality monitoring effort, the
AMP examines the health of the lake ecosystem by sampling fish, phytoplankton,
zooplankton, benthic invertebrates, aquatic plants and dreissenid (zebra and
quagga) mussels. The health of the watershed is assessed as well, through an
integrated program that focuses on identifying potential sources of materials
such as nutrients, sediment and bacteria.
Biological indicators of stream condition are evaluated as well. A Data Analysis and Interpretation Plan (DAIP) (Table 1-3) guides program
design and is a component of the annual workplan, and consequently subject to
NYSDEC review and approval.
A rigorous Quality Assurance/Quality Control program
is in place. The AMP workplan is subject
to NYSDEC review and approval each year. Samples are collected by trained
technicians and analyzed in a laboratory certified by the NYS Department of
Health. Internal and external audits are conducted, blanks and duplicates are evaluated, and the
results are presented in the annual AMP report. Experts serving on the Onondaga Lake Technical Advisory Committee (OLTAC) review the data and
interpretive reports each year and make recommendations.
An expert on statistics and lake water quality periodically reviews
the AMP design for its power to detect trends. That is, what sampling frequency
and duration are needed to differentiate a significant change, given the
magnitude of natural variation? This analysis, referred to as the Statistical Framework, has been completed for water quality and biological
parameters by Dr. William W. Walker,
a member of OLTAC. Dr. Walker’s evaluations of the AMP are available on his web site www.wwwalker.net/onondaga.
Each year, OCDWEP tests over 20,000 water
samples and examines several thousand biological samples. The County has
invested in the creation of custom databases to facilitate analysis and
reporting. The 2009 data have been appended to the water quality database,
which is a repository of tributary (T), lake (L) and river (R) data collected
since 1968. An integrated biological database is used to manage results of the
fisheries, phytoplankton, zooplankton, macroinvertebrate and macrophyte
monitoring efforts.
Table 1-4. Data Analysis and Interpretation Plan.
|
Parameters
|
Sampling
Locations
|
Compliance
|
TMDL
Analysis
|
Trend
Analysis
|
Trophic
Status
|
Load
Analysis
|
Model
Support
|
Use
Attainment
|
Effectiveness
of CSO
control
measures
|
Indicator
of
Water
Clarity
|
Nutrient
Cycling
|
Habitat
Conditions
|
Lake Ecology
|
|
Chemical
|
|
|
|
|
|
|
|
|
|
|
|
|
|
|
Alkalinity
|
L, T
|
|
|
![Description: Description: Description: Description: Description: Description: Description: Description: Description: Description: Description: Description: Description: Description: Description: Description: Description: Description: Description: Description: Description: Description: Description: Description: Description: Description: Description: Description: Description: Description: Description: Description: Description: Description: Description: Description: Description: MCWB01114_0000[1]](Rev%202_Nov2010_files/image014.gif)
|
|
|
|
|
|
|
|
|
|
|
Bacteria
|
L, T
|
|
|
|
|
|
|
|
|
|
|
|
|
|
BOD-5
|
L, T, R
|
|
|
|
|
|
|
|
|
|
|
|
|
|
Carbon
|
L, T, R
|
|
|
|
|
|
|
|
|
|
|
|
|
|
Cyanide
|
T
|
|
|
|
|
|
|
|
|
|
|
|
|
|
Mercury
|
L, T
|
|
|
|
|
|
|
|
|
|
|
|
|
|
Metals/Salts
|
L, T, R
|
|
|
|
|
|
|
|
|
|
|
|
|
|
Nitrogen
|
L, T, R
|
|
|
|
|
|
|
|
|
|
|
|
|
|
Phosphorus
|
L, T, R
|
|
|
|
|
|
|
|
|
|
|
|
|
|
Dissolved
Silica
|
L,T
|
|
|
|
|
|
|
|
|
|
|
|
|
|
Solids
|
L, T, R
|
|
|
|
|
|
|
|
|
|
|
|
|
|
Sulfides
|
L
|
|
|
|
|
|
|
|
|
|
|
|
|
|
Dissolved
Oxygen
|
L, T, R
|
|
|
|
|
|
|
|
|
|
|
|
|
|
Salinity
|
L, T, R
|
|
|
|
|
|
|
|
|
|
|
|
|
|
Physical
|
|
|
|
|
|
|
|
|
|
|
|
|
|
|
Conductivity
|
L, T, R
|
|
|
|
|
|
|
|
|
|
|
|
|
|
LiCor
illumination
|
L, R
|
|
|
|
|
|
|
|
|
|
|
|
|
|
Secchi
transparency
|
L, R
|
|
|
|
|
|
|
|
|
|
|
|
|
|
Turbidity
|
L, T, R
|
|
|
|
|
|
|
|
|
|
|
|
|
|
Biological
|
|
|
|
|
|
|
|
|
|
|
|
|
|
|
Chlorophyll-a/algae
|
L, R
|
|
|
|
|
|
|
|
|
|
|
|
|
|
Zooplankton
|
L
|
|
|
|
|
|
|
|
|
|
|
|
|
|
Macrophytes
|
L
|
|
|
|
|
|
|
|
|
|
|
|
|
|
Macroinvertebrates
|
L, T
|
|
|
|
|
|
|
|
|
|
|
|
|
|
Fish
|
L
|
|
|
|
|
|
|
|
|
|
|
|
|
|
Dreissenid
mussels
|
L,R
|
|
|
|
|
|
|
|
|
|
|
|
|
|
Locations:
L = Lake; T = Tributaries; R = Seneca
River.
|
|
|
|
|
|
|
|
|
|
|
1.3 Turning Data into Information: Metrics
A
series of metrics, defined as quantifiable physical, chemical and/or biological
attributes of the ecosystem that respond to human disturbances, is used to help
organize the extensive AMP dataset (Table 1-5).
For the Onondaga
Lake watershed, metrics
are used to indicate progress towards compliance and attainment of the
designated best use. Four categories address both human uses and ecosystem
function: (1) water contact recreation;
(2) aesthetics; (3) aquatic life protection; and (4) sustainable recreational
fishery. Note that the 2009 evaluation of lake conditions with respect to the
selected metrics is included in the Executive Summary (refer to Table EX-1).
The water quality parameters in this table are those attributed to the
discharges from Metro and the CSOs, as set forth in the ACJ. In addition to
these central indices, additional water quality parameters are monitored in the
lake, the tributary streams, and a segment of the Seneca River in order to
improve stakeholders’ understanding of ecosystem functioning and compliance
with other standards not directly related to wastewater (as summarized in Table
1-4).
|
Table 1-5. Summary of metrics used to evaluate progress toward
improvement.
|
|
Metrics
|
Measured
By
|
Target
Levels
|
|
Suitability
for Water Contact Recreation
|
|
Indicator
bacteria
|
Fecal coliform
bacteria abundance
|
100% of E.
coli and fecal coliform bacteria (monthly geometric means of at least 5
observations) in compliance with water quality standards.
Lake: compliance is measured during the Metro disinfection period (April 1
to October 15).
Tributaries: compliance is measured
year-round.
|
|
Water clarity
|
Secchi disk
transparency (nearshore, Class B)
|
Lake: 100% of water clarity
measurements greater than 4 ft. (1.2 m) between June and September, which is
the NYS swimming safety guidance value.
|
|
Aesthetic
Appeal
|
|
Water clarity
|
Secchi disk
transparency (open waters South Deep)
|
Lake: 100% of water clarity measurements greater than 5 ft. (1.5 m)
between June and September, which indicates conditions that are aesthetically
appealing for recreational uses (swimming and boating).
|
|
Algal blooms
|
Chlorophyll-a concentrations: frequency,
magnitude and duration of elevated levels
|
Lake: 85% of chlorophyll-a
measurements less than 15 µg/L between June and September (below a threshold
of algal abundance imparting a distinct greenish tinge to the water).
|
|
Lake: 90% of chlorophyll-a
measurements less than 30 µg/L between June and September (below a threshold
of algal abundance associates with a nuisance algal bloom).
|
|
Algal
community
structure
|
Identification
and enumeration of phytoplankton samples
|
Lake: Less than 10% of algal community biomass represented by
cyanobacteria (blue-green taxa).
|
|
Aquatic Life
Protection
|
|
Wastewater-
related parameters
|
Ammonia N and
nitrite concentrations, profiles through lake water column,
biweekly program in tributaries
|
Lake and tributaries: 100% of annual measurements in compliance
with standards designed to protect aquatic life.
|
|
Dissolved
oxygen (DO)
|
Profiles
through lake water column, annual biweekly program in tributaries
|
Lake and Tributaries: Daily average concentrations above 5 mg/L;
Instantaneous minimum concentration above 4 mg/L.
In NY, hypolimnetic anoxia in lakes during
stratification is not enforced as a violation of ambient water quality
standards, due to the challenges associated with defining natural conditions
vs. cultural eutrophication.
|
|
Other
chemical parameters listed in Table 1-4 (e.g., heavy metals)
|
Profiles
through lake water column, annual biweekly program in tributaries
|
Lake and tributaries: 100% of annual measurements in compliance
with standards designed to protect aquatic life.
|
|
Sustainable
Recreational Fishery
|
|
Habitat
quality
|
Aerial
photograph interpretation of macrophyte cover
|
Lake: At least 40% of the littoral zone supports abundant macrophyte
cover, based on optimal habitat for largemouth bass.
|
|
Fish species
successfully reproducing
|
Nesting
surveys, larval sampling, young-of-year sampling (littoral and pelagic) adult
surveys
|
Lake: Reproduction of target species as specified in the Amended Consent
Judgment
·
largemouth bass, smallmouth bass and sunfish
·
yellow perch
·
black crappie
·
rock bass
·
walleye and northern pike
|
|
Community structure
|
Percent of fish species intolerant or moderately intolerant of
pollution
|
Lake: Increasing presence of fish species sensitive to pollution.
|
1.4 Mathematical
Modeling
Monitoring data provide a means to evaluate
current conditions, compliance and trends. Monitoring data also serve to test
hypotheses and elucidate important processes and interactions affecting water
quality and aquatic habitat. However, projecting future conditions in response
to changing inputs and environmental conditions remains a significant
challenge. Projecting future conditions requires models; the most robust models
are constructed using data generated by a well-designed monitoring
program.
In recognition of the need to project future
water quality and habitat conditions, the ACJ requires development, calibration
and confirmation of mathematical models using the extensive AMP data to support
decisions related to Onondaga
Lake improvement
projects. Specifically, the models will
provide critical information needed to manage the lake and its watershed,
including the following:
·
An understanding of the mechanisms underlying
observed trends in the water quality of the lake;
·
A projection of the
benefits of Metro upgrades and CSO abatement measures;
·
A more complete
assessment of the assimilative capacity of the Seneca River
and its ability to accept diverted Metro effluent as well as the impact of such
a potential diversion on lake water quality;
·
A projection of the benefits of any proposed watershed best management practices
(BMPs);
·
Development of total maximum daily loads (TMDLs) for
phosphorus in the lake and support the development of a TMDL for dissolved
oxygen in the Seneca
River.
A suite of three
integrated mathematical models are near completion:
Ø
The Onondaga Lake Basin
Model, developed by the US Geological Survey (USGS) in cooperation with the
OLP, is designed to simulate the flow of water and materials (nutrients and
sediment) to the lake;
Ø
The Onondaga Lake Water
Quality Model (OLWQM), developed by Anchor QEA, is a mechanistic model
focusing on eutrophication; and
Ø
The Three Rivers Water
Quality Model (TRWQM), developed by Anchor QEA, is a mechanistic model
focusing on dissolved oxygen conditions in the Seneca River.
These models are designed to
quantify the response of Onondaga Lake and the Seneca River
to improvements in wastewater treatment and non-point source pollution control
measures within the watershed. The three
models are integrated, with output from one providing input to the next. The Onondaga Lake Basin Model was developed
by the USGS and calibrated using AMP data. The basin model supports a
quantitative analysis of how land use changes in the lake’s watershed affect
the water, nutrients, and sediment in runoff to Onondaga Lake. Managers can apply this model to estimate the
potential effectiveness of various control strategies such as changing
development patterns, or implementing best management practices in particular
areas. The USGS basin model can also be used to evaluate the need for measures
such as stormwater retention basins to mitigate peak runoff rates. Projected
tributary flows and loads from the Onondaga Lake Basin Model will be used as
input to the OLWQM to forecast the lake response to watershed measures, thus
providing linkage between the models.
The OLWQM and
TRWQM forecast how Onondaga Lake and the Seneca River
respond to inputs of water and materials.
These coupled Anchor QEA models will be used to evaluate the potential
environmental benefits realized by diverting the Metro outfall or achieving the
Stage III phosphorus limit. In addition
to providing managers with the tools to determine the level of treatment and
point of discharge from Metro, the two mechanistic models developed by Anchor
QEA are supporting similar evaluations of other Onondaga
County wastewater treatment plants
discharging to the Seneca
River, including the Wetzel Rd. and
Baldwinsville-Seneca Knolls facilities. Onondaga County
also works with Dr. William Walker to support the AMP design and data analysis
and interpretation tasks. Dr. Walker developed a mass-balance framework to track the input, output and retention of materials
(such as phosphorus) in Onondaga
Lake. This framework uses
hydrologic and water quality data collected in the lake and its tributaries
since 1986. Results provide a basis for three tasks:
1.
Estimating the magnitude of loads and
precision of load calculations from each source;
2.
Assessing long-term trends in load and inflow
concentration from each source and source category (point, nonpoint, and
total);
3.
Evaluating the adequacy of the monitoring
program, based upon the precision of loads computed from concentration and flow
data.
Reports on these efforts are available at http://www.wwwalker.net/onondaga.
1.5 Timeline of Onondaga Lake and Watershed
Events, 1998-2009

2. Onondaga Lake and its Watershed
The Onondaga Lake
watershed encompasses approximately 285 square miles almost entirely within Onondaga County, including six natural
sub-basins: Onondaga Creek, Ninemile Creek, Ley Creek, Harbor Brook, Bloody
Brook and Sawmill Creek (refer to Figure 1-1). Tributary 5A and the East Flume
direct runoff and industrial discharges into the lake. Much of the annual
volume of treated wastewater flowing to Onondaga
Lake though the Metro treatment plant
originates outside of the watershed; water supply for the City of Syracuse is drawn from Skaneateles Lake, and for suburban
towns and villages, Lake
Ontario. The outlet of Onondaga
Lake flows north to the Seneca River
and ultimately into Lake
Ontario. Onondaga Creek
is the largest water source to the lake, followed by Ninemile Creek, Metro, Ley
Creek and the smaller tributaries (Figure 2-1).
Figure 2-1. Hydrologic input to Onondaga Lake,
as percent of total. Source:
OCDWEP database.
Compared
with other lakes in the Seneca-Oneida-Oswego river basin, the watershed of Onondaga Lake is more urbanized, as displayed in
Figure 2-2, a map of land cover within the watershed. Approximately 28% of the
land cover is classified as developed (urban/suburban), 51% as forested or
scrub/shrub, and 9.5% as cultivated lands or pasture, with the remaining 12%
comprised of wetlands, lakes, and barren land. Urban areas of the City of Syracuse, two towns and
two villages border the lake.
Onondaga Lake is relatively small (Table 2-1). The shoreline is highly regular with few
embayments. The majority of the shoreline is owned by Onondaga County
and is maintained as part of a popular park and trail system. The parklands are
used for recreational activities, shoreline fishing and cultural entertainment.
The lake is increasingly popular for boating; sailboats, motorboats, kayaks and
canoes are familiar sights on summer days. Local and regional fishing
tournaments attract anglers to the lake and shoreline each year.
|
Table 2-1. Morphometric characteristics of Onondaga Lake.
|
|
Characteristic
|
Metric units
|
English units
|
|
Watershed area
|
738 km2
|
285 mi2
|
|
Lake:
|
|
|
|
Surface area
|
11.7 km2
|
4.5 mi2
|
|
Volume
|
131 x 106 m3
|
35 billion
gallons
|
|
Maximum length
|
7.6 km
|
4.7 mi.
|
|
Maximum width
|
2 km
|
1.2 mi.
|
|
Maximum depth
|
19.5 m
|
64 ft.
|
|
Average depth
|
11 m
|
36 ft.
|
|
Average elevation*
|
111 m
|
364 ft.
|
|
Average flushing rate
|
4
times/yr.
|
|
*Elevation is of the lake surface, referenced to mean sea level.
|

3.
Tributary Results: 2009 Water Quality Status and Trends
The 2009 water quality data indicate
continued progress toward compliance with ambient water quality standards and
restoration of designated uses. In this section, results of the 2009 monitoring
effort are summarized and compared with historical data.
3.1 Climatic Conditions
Each year, the tributaries
convey surface runoff and groundwater seepage from the large watershed toward Onondaga Lake. The volume of runoff, and
consequently streamflow, varies each year depending on the amount of rainfall
and snow cover. Overflows from the combined sewer system also vary in response
to the intensity and timing of rainfall events, and, to a lesser degree,
snowmelt. The Metro effluent volume exhibits less annual variation, although
the effects of extreme wet or dry years can be detected due to the portion of
the service area served by combined sewers.
Overall, 2009 was a
dry year in Syracuse; the total precipitation of 35.36 inches was
below the 30- year average (1979 – 2008) of 38.01 inches. The
winter was snowy, however (146 inches compared to the average 121 inches), and
June was extremely wet. Despite these variations, the average 2009
precipitation and temperature patterns were not inconsistent those
measured over the previous 30 years. The
climatic conditions were reflected in the streamflow conditions; streamflow
conditions in the major tributaries
remained
close to long-term average conditions, with spikes in late winter and June, and
additional spikes in response to late summer storm events.
3.2 Tributary Water
Quality and Annual Loads
Compliance with Ambient
Water Quality Standards
Several segments of Onondaga Lake’s
tributary streams have been placed on the NYSDEC compendium
of impaired waters, most recently updated in 2010.
Waterbodies are placed on this list when there is evidence that water
quality conditions are not in compliance with applicable standards, and/or the
water bodies do not support their designated use. Results of the County’s AMP
are among the primary data sets used to evaluate compliance. The 2009 tributary
data indicate that the major tributaries are generally in compliance
with standards, (Table 3-1) with some exceptions; the 2009 findings
were consistent with those of previous years. Ley Creek continues to exhibit
periodic exceedances of the ambient water quality standard for cyanide.
Tributary 5A, which receives treated industrial wastewater from Crucible
Specialty Metals, does not meet the copper standard. The East Flume exceeded
the ambient water quality standards for mercury, pH, nitrite and ammonia on a
regular basis during 2009. Monitoring for fecal coliform bacteria abundance in
the tributaries was not frequent enough to evaluate compliance with the
standard, which is expressed as the geometric mean of a minimum of five
observations each month. Beginning in April 2010, Onondaga County
increased sampling frequency in the tributaries to enable assessment of
compliance with the ambient water quality standard for fecal coliform bacteria.
|
Table
3-1. Percent of Onondaga Lake tributary sample results in
compliance with NYS water quality standards, 2009.
|
|
Monitoring
Site
|
Ammonia-N
|
Arsenic
|
Cadmium
|
Chromium
|
Copper
|
Cyanide
|
Dissolved
Oxygen*
|
Fecal
Coliform**
|
Lead
|
Mercury***
|
Nickel
|
Nitrite
|
pH
|
Zinc
|
|
Ninemile Creek at Lakeland
|
100%
|
100%
|
100%
|
100%
|
100%
|
100%
|
100%>4
100%>5
|
--
|
100%
|
--
|
100%
|
100%
|
96%
|
100%
|
|
Harbor Brook at Hiawatha
|
100%
|
100%
|
100%
|
100%
|
100%
|
100%
|
100%>4
100%>5
|
--
|
100%
|
--
|
100%
|
100%
|
96%
|
100%
|
|
Harbor Brook at Velasko
|
100%
|
100%
|
100%
|
100%
|
100%
|
100%
|
100%>4
100%>5
|
--
|
100%
|
--
|
100%
|
100%
|
100%
|
100%
|
|
Onondaga Creek at Kirkpatrick
|
100%
|
100%
|
100%
|
100%
|
100%
|
100%
|
100%>4
100%>5
|
--
|
100%
|
--
|
100%
|
100%
|
100%
|
100%
|
|
Onondaga Creek at Dorwin
|
100%
|
100%
|
100%
|
100%
|
100%
|
100%
|
100%>4
100%>5
|
67%
|
100%
|
--
|
100%
|
97%
|
98%
|
100%
|
|
Onondaga Creek at Spencer
|
--
|
--
|
--
|
--
|
--
|
--
|
100%>4
100%>5
|
0%
|
--
|
--
|
--
|
--
|
96%
|
--
|
|
Ley Creek at Park
|
100%
|
100%
|
100%
|
100%
|
100%
|
75%
|
100%>4
96%>5
|
--
|
100%
|
--
|
100%
|
100%
|
96%
|
100%
|
|
Tributary 5A at State
Fair Blvd.
|
96%
|
100%
|
100%
|
100%
|
0%
|
100%
|
100%>4
85%>5
|
--
|
100%
|
--
|
100%
|
96%
|
92%
|
100%
|
|
Allied East Flume
|
38%
|
100%
|
100%
|
100%
|
100%
|
100%
|
100%>4
100%>5
|
--
|
100%
|
--
|
100%
|
0%
|
85%
|
100%
|
|
Onondaga Lake Outlet (2ft)
|
100%
|
100%
|
100%
|
100%
|
100%
|
100%
|
100%>4
100%>5
|
--
|
100%
|
--
|
100%
|
100%
|
100%
|
100%
|
|
Onondaga Lake Outlet (12ft)
|
100%
|
100%
|
100%
|
100%
|
100%
|
100%
|
100%>4
92%>5
|
--
|
100%
|
--
|
100%
|
100%
|
100%
|
100%
|
|
Bloody Brook at Old
Liverpool Road
|
100%
|
100%
|
100%
|
100%
|
100%
|
100%
|
100%>4
100%>5
|
--
|
100%
|
--
|
100%
|
100%
|
100%
|
100%
|
|
Bloody Brook at Onondaga
Lake Parkway
|
100%
|
100%
|
100%
|
100%
|
100%
|
100%
|
100%>4
100%>5
|
--
|
100%
|
--
|
100%
|
100%
|
100%
|
100%
|
|
Sawmill at Onondaga
Lake Rec.
Area
|
100%
|
100%
|
100%
|
100%
|
100%
|
100%
|
100%>4
100%>5
|
--
|
100%
|
--
|
100%
|
100%
|
100%
|
100%
|
|
Notes:
* Dissolved
oxygen results shown for compliance with 4 mg/l (>4) and 5 mg/l (>5)
standards. For nontrout waters, the minimum
daily average shall not be less than 5.0 mg/L, and at no time shall the DO
concentration be less than 4.0 mg/L
(§703.3).
**
Fecal coliform compliance based on monthly geometric mean from a minimum of 5
measurements; only those stations with a minimum of 5 measurements in the
course of a given month were evaluated for compliance by this standard.
***Mercury
method reporting limit (MRL) is 0.02 μg/l, which is two orders of
magnitude greater than the compliance value of 0.0007 μg/l. 71% of the
analytical results were below the limit of detection. Given this data set,
one cannot ascertain whether mercury reported as non-detect to 0.02 μg/l
was present in the samples at levels above the regulatory limit of 0.0007
μg/l; therefore an accurate percent compliance cannot be calculated.
|
Compliance with Metro
SPDES Permit
Onondaga County
was in full compliance with conditions of the
State Pollution Discharge Elimination System (SPDES) permit regulating the
volume and quality of effluent discharged from the Metro facility to Onondaga Lake through Outfall 001. There were
four exceedances of permit limits on Outfall 002 (bypass) in 2009, two each for
total residual chlorine and settleable solids.
Effluent ammonia N remained well below the seasonal limits
of 1.2 mg/L (summer) and 2.4 mg/L (winter), as displayed in Figure 3-1.
Phosphorus concentrations were also consistently low throughout 2009 (Figure
3-2). As discussed in Section 1, the 2009 amendment to the ACJ revised the
interim Stage II TP effluent limit to 0.10 mg/L. Compliance with the revised
interim limit, which is expressed as a 12-month rolling average, will be
evaluated beginning in November 2010.
Flows and Loads
The 2009 flow-weighted average concentration of phosphorus,
ammonia-N, TKN, total suspended solids, fecal coliform bacteria and chloride
measured in the Onondaga
Lake tributaries and
Metro effluent are summarized in Table 3-2. For additional detail, including the
relative standard error of the means, refer to the Library Table
L05.2.1. Note that
fully-treated Metro effluent exhibits phosphorus concentrations comparable to
those of the natural tributaries.
Approximately 97% of flow reaching Metro in 2009 received advanced
treatment and entered the lake through Outfall 001; the remaining 3% received
primary treatment and entered the lake through Outfall 002 (bypass). Fully-treated Metro effluent is also much
less turbid (clearer) than water flowing to the lake from the natural
tributaries. Harbor Brook exhibited the highest abundance of fecal coliform
bacteria of all the tributaries during the biweekly monitoring program (which
does not specifically target storms).
Ninemile Creek, which does not receive CSOs, exhibited fecal coliform
bacterial abundance comparable to that measured in Onondaga Creek and Ley
Creek, which do receive CSOs.
|
Table 3-2. Flow-weighted average concentration of selected
parameters, 2009, Onondaga
Lake tributaries (with
number of samples in parentheses).
|
|
Parameter*
Units
|
TP
mg/L
|
SRP
mg/L
|
NH3-N
mg/L
|
TKN
mg/L
|
TSS
mg/L
|
Chloride
mg/L
|
Bacteria
cfu/100ml
|
|
Metro
Effluent **
|
0.080 (364)
|
0.003 (87)
|
0.28 (363)
|
1.2 (363)
|
5.5 (364)
|
499 (202)
|
829 (210)
|
|
Metro
Bypass
|
1.13 (41)
|
0.15 (2)
|
5.9 (41)
|
10 (41)
|
56 (41)
|
615 (2)
|
270,226 (29)
|
|
Onondaga
Creek
|
0.085 (26)
|
0.008 (26)
|
0.066 (26)
|
0.57 (26)
|
63 (26)
|
422 (26)
|
1,620 (26)
|
|
Ninemile
Creek
|
0.069 (26)
|
0.010 (26)
|
0.22 (26)
|
0.73 (26)
|
30 (26)
|
268 (26)
|
2,178 (26)
|
|
Ley Creek
|
0.10 (26)
|
0.016 (26)
|
0.28 (26)
|
0.83 (26)
|
24 (26)
|
336 (26)
|
1,916 (26)
|
|
Harbor
Brook
|
0.092 (31)
|
0.037 (31)
|
0.081 (26)
|
0.48 (31)
|
29 (31)
|
280 (31)
|
6,312 (32)
|
|
Tributary
5A
|
0.12 (26)
|
0.037 (26)
|
0.15 (26)
|
0.46 (26)
|
19 (26)
|
351 (26)
|
73 (26)
|
|
East Flume
|
0.11 (26)
|
0.030 (26)
|
0.90 (26)
|
1.4 (26)
|
11 (26)
|
570 (26)
|
110 (26)
|
|
Tributaries results are reported for downstream
sampling locations closest to Onondaga
Lake.
Flow-weighted average concentrations were computed on each sampled day using instantaneous flows for Storm Event
samples and daily mean flows for Routine samples.
*TP = Total Phosphorus; SRP = Soluble
Reactive Phosphorus; NH3-N = Ammonia as N; TKN = Total Kjeldahl Nitrogen; TSS = Total
Suspended Solids; Bacteria = Fecal Coliform bacteria
** METRO effluent NH3-N, TP, and TSS based on
daily measurements, Metro bypass is only sampled when active.
|
The 2009 loading of these selected parameters (Table 3-3)
illustrates the importance of the relative flow volume on total external
loading of nutrients, sediment, chloride and bacteria to the lake. The values presented in Table 3-3 are generated by
a customized loading model that uses the detailed flow record and results of
grab samples of water quality conditions; the significant figures in the table
should not be interpreted as presenting the precision of the estimates. The
percent of the total load attributed to each source is summarized in Table 3-4.
Note that 2009
results for all measured
parameters, and the standard error of the estimates, are presented in the
library.
|
Table 3-3. Annual loading of selected water
quality parameters, in metric tons (mt), to Onondaga Lake
in 2009. Number of samples is shown
in parentheses.
|
|
Parameter*
Units
|
TP
mt
|
SRP
mt
|
NH3-N
mt
|
TKN
mt
|
TSS
mt
|
Chloride
mt
|
Bacteria
1010 cfu
|
|
Metro
Effluent (1)
|
6.5 (364)
|
0.21 (87)
|
23 (363)
|
94 (363)
|
450 (364)
|
40,567 (202)
|
67,319 (210)
|
|
Metro
Bypass (2)
|
2.5 (41)
|
0.33 (2)
|
13 (41)
|
22 (41)
|
121 (41)
|
1,330 (2)
|
584,782 (29)
|
|
Onondaga
Creek
|
13 (26)
|
1.3 (26)
|
10 (26)
|
89 (26)
|
9,896 (26)
|
66,414 (26)
|
254,682 (26)
|
|
Ninemile
Creek
|
10 (26)
|
1.5 (26)
|
33 (26)
|
112 (26)
|
4,545 (26)
|
40,749 (26)
|
331,038 (26)
|
|
Ley Creek
|
3.7 (26)
|
0.59 (26)
|
10 (26)
|
30 (26)
|
891 (26)
|
12,271 (26)
|
69,878 (26)
|
|
Harbor
Brook
|
0.88 (31)
|
0.36 (31)
|
0.77 (26)
|
4.6 (31)
|
277 (31)
|
2,676 (31)
|
60,306 (32)
|
|
Tributary
5A
|
0.17 (26)
|
0.052 (26)
|
0.21 (26)
|
0.65 (26)
|
27 (26)
|
492 (26)
|
103 (26)
|
|
East Flume
|
0.12 (26)
|
0.033 (26)
|
0.97 (26)
|
1.5 (26)
|
11 (26)
|
617 (26)
|
119 (26)
|
|
Tributaries results are reported for downstream
sampling locations closest to Onondaga
Lake.
The flow-weighted-mean concentration is computed
for each day before being used in computing loads.
*TP = Total Phosphorus; SRP = Soluble Reactive
Phosphorus; NH3-N = Ammonia as N; TKN =
Total Kjeldahl Nitrogen; TSS = Total Suspended Solids; Bacteria =
Fecal Coliform bacteria.
(1) Metro Outfall 001 calculated loads of NH3-N,
TP, TSS are based on daily measurements; METRO TKN based on 5 measurements/2
wks
(2) Metro Bypass Outfall 002 estimates based on
periodic grab samples when outfall is active (high flow events where the
capacity of the treatment plant is exceeded).
|
|
Table 3-4. Percent annual
loading contribution by gauged inflow, 2009.
|
|
Parameter*
|
TP
|
SRP
|
NH3-N
|
TKN
|
TSS
|
Chloride
|
Bacteria
|
Water
|
|
Metro
Effluent
|
17%
|
4.8%
|
25%
|
27%
|
2.8%
|
25%
|
4.9%
|
18%
|
|
Metro
Bypass
|
6.5%
|
7.5%
|
14%
|
6.3%
|
0.75%
|
0.81%
|
43%
|
0.49%
|
|
Onondaga
Creek
|
36%
|
30%
|
11%
|
25%
|
61%
|
40%
|
19%
|
36%
|
|
Ninemile
Creek
|
28%
|
34%
|
36%
|
32%
|
28%
|
25%
|
24%
|
35%
|
|
Ley Creek
|
9.7%
|
13%
|
11%
|
8.5%
|
5.5%
|
7.4%
|
5.1%
|
8.3%
|
|
Harbor
Brook
|
2.3%
|
8.1%
|
0.85%
|
1.3%
|
1.7%
|
1.6%
|
4.4%
|
2.2%
|
|
Tributary
5A
|
0.46%
|
1.2%
|
0.23%
|
0.18%
|
0.16%
|
0.30%
|
0.008%
|
0.32%
|
|
East Flume
|
0.33%
|
0.75%
|
1.1%
|
0.42%
|
0.07%
|
0.37%
|
0.009%
|
0.25%
|
|
*TP = Total Phosphorus; SRP = Soluble
Reactive Phosphorus; NH3-N = Ammonia as N; TKN = Total Kjeldahl Nitrogen; TSS = Total
Suspended Solids; Bacteria = Fecal Coliform bacteria.
|
In 2006, OCDWEP and
USGS initiated a joint project to enhance data collection at two sites on
Onondaga Creek, to provide additional data regarding the influence of rural and
urban watersheds on stream water quality:
- Route 20 in Lafayette, in the rural headwaters, and
- Spencer Street in Syracuse,
in the urban area affected by CSO discharges.
A new gauging station
was constructed at Route 20 in 2006, while an existing gauging station was
upgraded at Spencer Street. In-situ water quality monitoring devices (sondes) and meteorological data collection capabilities were
installed, including precipitation collection equipment outfitted with heating
elements to measure snowfall precipitation water equivalents.
The following 2009
data files are included in the Library:
Onondaga Creek
tributary data were also used to evaluate
contributions in 2009 from the rural land use characteristic of the
tributary’s headwaters (Route 20 monitoring station), predominantly
rural watershed (Dorwin Ave.
monitoring station) and predominantly urban watershed (Spencer St. monitoring station), based on
concentration, flow, instantaneous loading, and contributing area.
Storm Events
Storm event sampling
is conducted periodically in addition to the biweekly monitoring program, in an
effort to characterize peak flow and loading conditions. Events are initiated
when the forecast predicts heavy rains; storms with rainfall of sufficient
intensity to trigger the CSOs (at least 0.35 inches per hour) are targeted.
DWEP field technicians collect samples at multiple locations and at frequent
intervals during the storm and for up to 48 hours after it subsides.
Storm events are
conducted as remedial projects are completed; results are compared with
baseline (pre-improvement) data. Loads
of fecal coliform bacteria, chloride, TP, SRP, total dissolved P (defined as
all non-particulate P fractions), total suspended solids, and total Kjeldahl N
(defined as organic N and ammonia) are calculated over the course of the storm.
These results are added to the cumulative database of storm loads, and compared
to tributary-specific baseline (pre-improvement) conditions, as a function of
the total volume of storm flow. The hypothesis is that improvements to the
collection system will result in reduced loading of fecal coliform bacteria and
other wastewater-related parameters.
Water quality
monitoring of Onondaga Creek was completed during one intense rainfall event in
August 2009. The storm was of short duration (approximately 0.8 inches in one
hour), and most of the samples were collected just after the peak flow, on the
receding limb of the hydrograph,
highlighting the challenge of responding to storm events and the potential
value of automated sampling devices. The Midland Ave. Regional Treatment Facility
(RTF) was completed in May 2008. After a one-year testing phase, Onondaga
County DWEP began operation of the facility on May 15, 2009. This RTF was
designed to capture and treat the mixture of storm water runoff and untreated
sewage from three large CSOs.
Information from the real-time supervisory control and data acquisition
(SCADA) system indicated that some of the combined sewage volume (estimated at
no more than 1.2 million gallons) was released to Onondaga Creek through the
emergency overflow diversion during the August, 2009 event, due to a delay in
activating the influent pumps. In addition, approximately 32,300 gallons were
released to Onondaga Creek after disinfection. The remaining combined sewage
volume was stored and pumped back to Metro for full treatment. OCDWEP prepares quarterly
reports to NYSDEC with operational details for RTFs, flow control
facilities and the Erie Boulevard Storage System (EBSS).
Given the short
duration of the August storm, the total storm volume was relatively low
compared with other events captured as part of the AMP. The total
loading of fecal coliform bacteria, phosphorus and solids were comparable to
the loading estimates from previous storm events.
Wet and Dry Weather Events
The concentration of fecal coliform bacteria present in the
lake tributaries during wet weather is affected by stormwater runoff and
overflow of the combined sewers. CSO
remedial measures and improved stormwater management techniques are underway.
Among the objectives of the AMP is a storm event monitoring program to track
changes in bacterial concentrations and loading to Onondaga Lake
during wet weather. Another objective is to track bacterial abundance during
non-storm periods as a means of identifying any illicit connections of sanitary
waste to the stormwater collection systems, or portions of the sewerage
infrastructure in need of repair.
To help meet these two related objectives, bacterial
quality of the CSO-affected streams is evaluated at both low flow and high flow
conditions by segregating the data set based on antecedent precipitation over
the 1990-2009 annual monitoring years. The total annual loadings
of bacteria from the monitored inflows to Onondaga Lake
were categorized based on whether a year was considered “dry” or “wet”. At this
aggregated level, there is no apparent correlation between total annual loading
and rainfall.
Both Harbor Brook
and Onondaga Creek have stations upstream and downstream of the urban
CSO-affected corridor. Comparing these upstream and downstream stations reveals
changes in loading as the streams flow through the urban corridor. Ninemile
Creek receives stormwater runoff from a separate sewer system. Examining the summer
average concentrations categorized by low and
high flows, it is clear that the fecal coliform concentrations are higher when
flows are higher; also, that concentrations at stations downstream of CSOs are
higher than at stations upstream of CSOs.
Over time, the concentrations during summer low flow conditions are consistently higher downstream of CSOs than upstream. Since CSOs are not active during dry weather
conditions, the higher concentrations observed downstream are not attributable
to this source.
During 2009, higher fecal coliform
concentrations observed in the tributaries were generally associated with wet
weather conditions. As in the past,
concentrations were typically higher at monitoring stations downstream of CSOs
than upstream. Wet weather fecal coliform bacteria levels were notably elevated
at the downstream station on Harbor Brook.
Trends
With the phosphorus reduction in
Metro effluent achieved by the 2005 start-up of the advanced physical-chemical
treatment process, the loading of phosphorus to Onondaga Lake
has been significantly reduced (Figures 3-3, 3-4 and 3-5). The watershed is now
the larger source of total and total soluble phosphorus to the lake. The
decrease illustrated in Figures 3-3 and 3-4 are statistically significant, as
summarized in Library Table L05.2.1. The strong relationship between the
external phosphorus load and the summer average concentration at the South Deep
station is illustrated in Figure 3-5.
Comparison of phosphorus
loading before the ACJ (1990-1998) and after implementation of the ActiFlo
system at Metro (2005-2009) indicates the magnitude of reduction in phosphorus
loading realized by this technology (Tables 3-5 and 3-6).
|
Table
3-5. Tributary and Metro Total Phosphorus (TP) Loading to Onondaga Lake, pre-ACJ and post-ActiFlo
implementation. (mt = metric tons;
concentrations flow-weighted).
|
|
|
1990-1998 (pre-ACJ)
|
2005-2009 (post-ActiFlo)
|
|
Location
|
Flow
(%)
|
TP
(mt)
|
TP
(% Load)
|
TP
(mg/l)
|
Flow
(%)
|
TP
(mt)
|
TP
(% Load)
|
TP
(mg/l)
|
|
Metro:
|
|
|
|
|
|
|
|
|
|
fully treated
|
21%
|
52
|
57%
|
0.56
|
18%
|
11
|
26%
|
0.12
|
|
bypass
|
0.94%
|
8.5
|
7.5%
|
1.8
|
0.36%
|
2.0
|
4.9%
|
1.2
|
|
Watershed:
|
|
|
|
|
|
|
|
|
|
Onondaga Creek
|
34%
|
20
|
19%
|
0.12
|
37%
|
14
|
34%
|
0.077
|
|
Ninemile Creek
|
32%
|
10
|
10%
|
0.065
|
34%
|
9.1
|
23%
|
0.055
|
|
Ley Creek
|
8.7%
|
5.7
|
5.8%
|
0.14
|
8.1%
|
3.5
|
8.7%
|
0.087
|
|
Harbor Brook
|
2.1%
|
0.71
|
0.71%
|
0.070
|
2.5%
|
1.1
|
2.8%
|
0.092
|
|
Tributary 5A
|
0.72%
|
0.17
|
0.19%
|
0.054
|
0.23%
|
0.13
|
0.31%
|
0.11
|
|
East Flume
|
0.23%
|
0.19
|
0.18%
|
0.20
|
0.17%
|
0.11
|
0.27%
|
0.14
|
|
Totals
|
100%
|
97
|
100%
|
--
|
100%
|
41
|
100%
|
--
|
|
Table 3-6.
Tributary and Metro
Soluble Reactive Phosphorus (SRP) Loading to Onondaga Lake,
pre-ACJ and post-ActiFlo implementation. (mt = metric tons; concentrations
flow-weighted).
|
|
|
1990-1998 (pre-ACJ)
|
2005-2009 (post-ActiFlo)
|
|
Location
|
Flow
(%)
|
SRP
(mt)
|
SRP
(% Load)
|
SRP
(mg/l)
|
Flow
(%)
|
SRP
(mt)
|
SRP
(% Load)
|
SRP
(mg/l)
|
|
Metro:
|
|
|
|
|
|
|
|
|
|
fully treated
|
21%
|
12
|
59%
|
0.13
|
18%
|
0.74
|
12%
|
0.008
|
|
bypass
|
0.94%
|
2.5
|
9.7
|
0.50
|
0.36%
|
0.42
|
7.9%
|
0.24
|
|
Watershed:
|
|
|
|
|
|
|
|
|
|
Onondaga Creek
|
34%
|
3.3
|
16%
|
0.021
|
37%
|
1.6
|
30%
|
0.009
|
|
Ninemile Creek
|
32%
|
1.7
|
7.9%
|
0.011
|
34%
|
1.5
|
29%
|
0.009
|
|
Ley Creek
|
8.7%
|
1.4
|
6.1%
|
0.033
|
8.1%
|
0.55
|
11%
|
0.014
|
|
Harbor Brook
|
2.1%
|
0.25
|
1.1%
|
0.024
|
2.5%
|
0.43
|
8.5%
|
0.035
|
|
Tributary 5A
|
0.72%
|
0.030
|
0.17%
|
0.010
|
0.23%
|
0.034
|
0.65%
|
0.029
|
|
East Flume
|
0.23%
|
0.065
|
0.29%
|
0.092
|
0.17%
|
0.036
|
0.70%
|
0.046
|
|
Totals
|
100%
|
21
|
100%
|
---
|
100%
|
5.2
|
100%
|
---
|
In a similar manner, the
improvements to Metro have resulted in a statistically significantly reduction
in the input of ammonia-N to Onondaga
Lake (Figure 3-6). Note
that the total nitrogen in the effluent has remained relatively constant. The
Biologically Aerated Filtration (BAF) process that came on-line in 2004
achieved year-round nitrification (biologically-mediated oxidation) of ammonia
to nitrate-N. Prior to implementation of the BAF, Metro effluent (fully-
treated discharge through Outfall 001 plus bypass) represented about 90% of the
external ammonia loading to Onondaga
Lake; both the percent
contribution of Metro to the total load and the total load itself are now
greatly diminished (Figure 3-7).
Tables summarizing a statistical analysis of the trends in
concentrations and loading of parameters in
addition to ammonia and total P are in the library.

4.
Onondaga Lake: 2009 Water Quality Status and Trends
The AMP is designed to
evaluate the response of Onondaga
Lake to improvements
implemented at the Metro facility and the CSOs.
In addition, data are collected to evaluate other chemical parameters in the lake, including low-level mercury.
Samples are collected from
nearshore sampling stations as well as two mid-lake stations. The South Deep mid-lake station is sampled
with greater frequency; the North Deep station is sampled four times per year
to confirm that water quality conditions measured at the South Deep
station continue to be representative of mid-lake conditions.
4.1 Trophic State Indicator
Parameters
Onondaga Lake can be characterized by its trophic
status, that is, how much sunlight it converts to organic matter through
photosynthesis. Highly productive systems are termed eutrophic, while systems with low levels of productivity are termed
oligotrophic. Those in between are called mesotrophic. Excessive productivity can result in
conditions that impair a waterbody for a particular use, such as water supply
or recreation.
The productivity of Onondaga Lake,
like most lakes in the Northeast, is limited by the availability of
phosphorus. Adding phosphorus induces
eutrophication, and such over-productive waters support an abundant community
of algae and cyanobacteria (blue-green algae). Approximately 50 species of
cyanobacteria have been shown to produce toxins that are harmful to vertebrates
(Codd 1995).
When algal biomass settles to the lower, unlighted areas of
a productive lake, its decay robs the lower waters of dissolved oxygen, making
them uninhabitable by fish or other oxygen-requiring organisms. Under these anaerobic or oxygen-free
environments, undesirable compounds such as ammonia and soluble phosphorus may
be liberated from the sediments.
Monitoring the trophic status of impaired waters like Onondaga Lake involves tracking several key
parameters to assess the type and abundance of algae, and the chemistry of the
deep waters. Three primary trophic state indicator parameters are used to
evaluate a lake’s trophic status and trends: total P, chlorophyll-a and Secchi disk transparency.
Total Phosphorus (TP)
Since the
productivity of Onondaga
Lake is limited by the
availability of phosphorus in the water, total phosphorus concentration (TP) is
an important indicator of trophic status. Phosphorus concentrations in the lake’s
upper waters are in steep decline (Figure 4-1), averaging 17 µg/L over
the summer of 2009, comparable to conditions in nearby Oneida Lake and several
of the smaller Finger Lakes. The summer of
2009 marked the second consecutive year that the total P concentration in Onondaga Lake waters complied with the state’s guidance value of 20 µg/L, which was established to protect recreational uses.
Chlorophyll-a
One of the undesirable attributes of eutrophic waters is
their green-tinged water and turbidity, or cloudiness, which is usually caused
by the large populations of algae containing the photosynthetic pigment
chlorophyll-a. The measurement of chlorophyll-a is, therefore, a more or less direct
measurement of the turbidity of the water as well as an indicator of its
productivity, since the amount of photosynthesis correlates strongly with the
amount of chlorophyll-a in the water.
The federal EPA and NYSDEC are developing nutrient criteria for lakes to
protect water supply and recreational use, as well as deriving numerical limits
on response variables such as chlorophyll-a. In the absence of state or federal
criteria, the AMP has used site-specific criteria of 15 and 30 ug/L to screen
algal bloom thresholds for Onondaga
Lake; these values have
not been promulgated and are not enforceable.
In Onondaga
Lake, chlorophyll-a concentrations above 15 µg/L are
associated with green-tinged and turbid waters that are less appealing for
recreational use. Nuisance bloom conditions are defined as chlorophyll-a concentrations greater than 30
μg/L. There were no algal blooms in Onondaga Lake
during the summer recreational period of 2009 (Figure 4-2). The average and
peak concentrations of this plant pigment have declined significantly (Figure
4-3). Summer data are displayed to track suitability of the lake for
recreational uses. The annual data provide additional information regarding
peak concentrations of chlorophyll that may be associated with spring and/or
fall algal blooms.
In lakes where phytoplankton
abundance is limited by phosphorus, the two trophic state parameters are highly
correlated. Data from regional lakes (Figure 4-4) illustrate this relationship.
Data for the Finger Lakes represent results of
a NYSDEC survey conducted between 1996 and 1999. NYSDEC rejected their phosphorus data from
1998 for quality control reasons. The NYSDEC study design called for sampling
each Finger Lake
monthly over the summer season at a single mid-lake station, with the exception
of Cayuga Lake which was sampled at three
locations (Callinan 2001). Oneida Lake data were supplied by the Cornell Biological
Field Station (Lars Rudstam, personal communication, June 2010). Oneida Lake is
notably shallower than the Finger Lakes and
does not develop stable thermal stratification during the summer.
The progressive reduction in TP concentration in Onondaga Lake is illustrated in Figure 4-4, as is
the extent to which recent conditions are comparable to those measured in
regional lakes. Note that the measured
chlorophyll-a concentration in Oneida
Lake is lower than predicted from the regression of the Finger
Lakes data. This is attributed to food web effects; many grazing
organisms (for example, dreissenid mussels and larger zooplankton) can
effectively keep algal abundance low. In contrast, the relatively elevated
chlorophyll-a in Onondaga Lake
in 2007, considering the lake’s TP concentration that
summer, is likely a result of diminished grazing pressure. The alewife was
highly abundant in 2007; this clupeid fish had virtually eliminated larger
zooplankton species such as Daphnia sp.,
which are more efficient grazers of phytoplankton. In the absence of the
grazing pressure from the larger zooplankton, the 2007 phytoplankton standing
crop was relatively high.
Secchi Disk Transparency
Another—and more direct—indicator of
turbidity of the water is the Secchi disk transparency. A Secchi disk is a 25 cm diameter disk with
alternating black and white quadrants.
It can be lowered into the lake, and the depth at which it can no longer
be seen from the surface or from the deck of a boat, is known as the Secchi disk
transparency. Greater depth indicates
clearer and less productive waters.
Highly productive waters may have Secchi disk readings of less than one
meter. Water clarity data are influenced by both bottom-up (nutrient levels)
and top-down (food web) effects; the presence and abundance of grazing
organisms has a major impact on the algal community.
To meet swimming safely guidance, Secchi disk transparency
greater than 1.2 m (4 ft) is required at designated beaches (see Table 4-2). There
is no NYS standard or guidance value for Secchi disk transparency of off-shore
waters; most lake monitoring programs in the state monitor Secchi disk
transparency at a mid-lake station overlying the deepest water, comparable to
Onondaga Lake South Deep station. The Citizens Statewide Lake Assessment
Program (CSLAP),a joint effort of NYSDEC and the NYS Federation of Lake
Associations, considers summer average Secchi disk transparency greater than 2
m as indicative of mesotrophic conditions (Kishbaugh 2009). The water clarity
of Onondaga Lake was high in 2009, averaging 3.2 m
over the four-month summer period, with periods in mid-summer exhibiting
exceptional water clarity, approaching 6 m (Figure 4-5).
In addition to Secchi disk transparency, readings are made
of light extinction using a LiCor data
logger. These readings correlate with Secchi measurements.
Trophic State Index
The three trophic
state indicator parameters can be expressed on a common scale, ranging from 1
to 100, with higher values indicating greater productivity (Carlson 1997). By all measures, the
trophic state of Onondaga Lake has shifted dramatically, as demonstrated by
reductions in the lake’s trophic state index, or
TSI, (Figure 4-6) calculated from summer average total P, chlorophyll-a and Secchi disk transparency. The 2009
results confirm that Onondaga
Lake has become less
productive, and all three
trophic state indicator parameters are now clearly in the mesotrophic range.
4.2 Ammonia and Nitrite
Until recently, Onondaga Lake was considered impaired by elevated
concentrations of ammonia; concentrations of this potentially harmful form of nitrogen
exceeded the state ambient water quality standard for aquatic life protection
(Table 4-1). The lake is now in full compliance with ambient water quality
standards for ammonia, and in 2008 was officially removed from the State’s
303(d) list of impaired waterbodies for this water quality parameter. In a
similar manner, the measured
concentrations of nitrite N were in compliance with the NYS ambient
water quality standard for a warm water fish community during the 2009
monitoring period.
|
Table 4-1. Percent of Ammonia
Measurements in Compliance with Ambient Water Quality Standards, Onondaga
Lake, 1998-2009.
|
|
Depth
|
Percent measurements in compliance, NYS standard
|
|
(m)
|
1998
|
1999
|
2000
|
2001
|
2002
|
2003
|
2004*
|
2005
|
2006
|
2007
|
2008**
|
2009
|
|
0
|
64
|
62
|
86
|
95
|
68
|
96
|
100
|
100
|
100
|
100
|
100
|
100
|
|
3
|
45
|
67
|
90
|
90
|
68
|
96
|
100
|
100
|
100
|
100
|
100
|
100
|
|
6
|
50
|
86
|
90
|
95
|
73
|
100
|
100
|
100
|
100
|
100
|
100
|
100
|
|
9
|
41
|
76
|
90
|
95
|
73
|
100
|
100
|
100
|
100
|
100
|
100
|
100
|
|
12
|
18
|
52
|
90
|
81
|
50
|
80
|
100
|
100
|
100
|
100
|
100
|
100
|
|
15
|
23
|
52
|
57
|
52
|
41
|
56
|
80
|
100
|
100
|
100
|
100
|
100
|
|
18
|
23
|
48
|
52
|
38
|
32
|
48
|
75
|
95
|
95
|
100
|
100
|
100
|
|
* Advanced ammonia treatment came on line in early 2004
** In 2008, Onondaga
Lake was de-listed for ammonia
impairment on the state 303(d) list
|
4.3 Recreational
Quality
Recreational
quality of Onondaga
Lake is evaluated using
two parameters: fecal coliform bacteria and water
clarity. In New York,
fecal coliform bacteria are used to indicate the potential presence of raw or partially
treated sewage in water. Although most
strains of fecal coliform bacteria are not harmful, this class of bacteria is
present in the intestinal tract of all mammals; the presence and abundance of
fecal coliform bacteria in water is correlated with the risk of encountering
pathogenic (disease-causing) microorganisms, including bacteria, viruses and
parasites. Abundance of these indicator bacteria in nearshore areas of Onondaga Lake is used to monitor compliance with
ambient water quality standards and the attainment of contact recreational use.
Bacteriological
data often vary by orders of magnitude due to the event-driven nature of the
sources. For that reason, geometric means are best suited for examining spatial
and temporal trends. Examining nearshore summer data
collected since 1999 (Figure 4-7), it is clear that bacteria levels are
consistently higher in the southern region of Onondaga Lake, close to the major
inflows, as compared to the northern region.
Bacteria levels at the Class B stations and the lake outlet are low,
confirming that the fecal coliform bacteria do not persist in the lake
environment long enough, and are sufficiently diluted, to be present in the
northern stations at levels of potential concern to human health. The results displayed
in these graphs include both routine samples and samples collected during and
shortly after storm events.
The data in Figure 4-7
demonstrate trends and relative abundance of the indicator bacteria, but do not
evaluate compliance with standards. The NY state standard for fecal coliform
bacteria is assessed by taking frequent samples at each location, a minimum of
five per month, and calculating the geometric mean of the results. The ambient
water quality standard for fecal coliform bacteria, designed to protect human
health during water contact recreation, is set at 200 cfu (colony-forming
units) per 100 ml of lake water. The standard applies during the period of
Metro disinfection, which is April 1st –
October 15th. In 2009, the standard was met
at all but one monitoring location. All stations in the Class B portion of the
lake were in full compliance, as shown in Figure 4-8. Bacteria levels in portions of the lake
typically increase after significant storm events. The occasional high bacteria levels is one
reason why there are no designated bathing beaches on Onondaga Lake;
the potential presence of industrial residuals in sediment is another
consideration.
Water
clarity is measured at the same network of near-shore stations. While there is
no NYSDEC standard for water clarity, the NYS Department of Health (DOH) has a
swimming safety guidance value for designated bathing beaches of 4 ft. (1.2 m).
The 2009 results demonstrate that the DOH swimming safety guidance value was
met throughout the summer recreational period (June 1st - Sept 30th).
|
Table 4-2. Nearshore Secchi disk
transparency statistical summary for Onondaga Lake, 2009.
|
|
|
|
Secchi Depth (m)a
|
% Observations
|
% Observations
|
% Observations
|
|
Station
|
Location Description
|
N
|
Mean
|
Max
|
Min
|
>1.2m
(Jun 1 to Sep 30)b
|
on bottom,
totalc
|
on bottom in
<1.2m depthd
|
|
Class C
|
|
|
|
|
|
|
|
|
|
Ninemile Creek
|
near mouth of
Ninemile Creek
|
22
|
1.3
|
3.1
|
0.2
|
95%
|
86%
|
9.1%
|
|
Ley Creek
|
near mouth of
Ley Creek
|
22
|
1.3
|
>1.5
|
0.9
|
90%
|
91%
|
9.1%
|
|
Metro
|
near mouth of
Metro discharge
|
22
|
1.2
|
>1.5
|
>0.6
|
100%
|
100%
|
14%
|
|
Onondaga Creek
|
near mouth of
Onondaga Creek
|
22
|
1.1
|
2.2
|
0.1
|
43%
|
5%
|
4.5%
|
|
Harbor Brook
|
near mouth of
Harbor Brook
|
22
|
1.3
|
>1.5
|
>0.9
|
100%
|
100%
|
4.5%
|
|
Class B
|
|
|
|
|
|
|
|
|
|
Wastebeds
|
north of mouth of
Tributary 5A
|
22
|
1.6
|
4.1
|
>1.2
|
100%
|
91%
|
0%
|
|
Maple Bay
|
north end of the lake,
south of outlet
|
22
|
1.4
|
3.0
|
>1.1
|
100%
|
95%
|
4.5%
|
|
Willow Bay
|
north end of the lake,
north of outlet
|
21
|
1.4
|
>1.7
|
>1.2
|
100%
|
100%
|
0%
|
|
Onondaga
Lake Park
|
Onondaga Lake
Park,
north of marina
|
21
|
1.3
|
>1.5
|
>1
|
100%
|
100%
|
4.8%
|
|
Bloody Brook
|
near mouth of
Bloody Brook
|
22
|
1.3
|
>1.5
|
>1
|
100%
|
100%
|
9.1%
|
|
a Statistics
include observations for which the Secchi disk was visible on the bottom of
the lake in less than 1.2 m of water. The ">" ("greater
than") symbol indicates the Secchi disk was visible on the bottom for
this measurement. Sampling at the
nearshore stations is standardized to an area of 1.2-1.5 m depth.
b Observations
>1.2 m are in compliance with swimming safety guidelines; the percent
compliance does not include those measurements for which the Secchi disk was
visible on the bottom of the lake in less than 1.2 m of water.
c Percent of
total observations at each location for which the Secchi disk was visible on
the bottom of the lake.
d Percent of
total observations at each location for which the Secchi disk was visible on
the bottom of the lake in less than 1.2 m of water.
|
4.4 Metro Improvements
and Lake Response
The improvements to the Metro
treatment plant have resulted in significant reductions in ammonia and
phosphorus loads to Onondaga
Lake , and an associated
steep decline in the concentrations of these nutrients in the lake water.
Productivity has declined, algal biomass is reduced, and the lake currently
exhibits mesotrophic conditions. The
strong correlation between Metro TP load and lake response is illustrated in
Figure 4-9. The loading calculations presented in this graph are based on water year (October 1- Sept 30), due to the relatively short
residence time (flushing rate three to four times per year) of Onondaga Lake waters. The summer average
conditions are therefore more strongly affected by more recent inflows.
Effluent total N has remained
relatively constant as the total P has declined, resulting in a significant
increase in the N:P ratio of
Metro effluent as
well as the N:P ratio of the lake’s upper waters (Figure 4-10). The N:P ratio
of a lake’s upper waters indicates the relative availability of the two important
nutrients to the algal community, and the extent to which primary production is
limited by phosphorus. The increasing N:P ratio in Onondaga Lake
evident in Figure 4-10 is consistent with increasing P limitation. When the
N:P supply ratio declines below a
critical value, in the range of 15:1 or lower, P is present in abundance
relative to the stoichiometric needs of the algal cells, and N may become limiting (Hall
et al. 2005). Once N is limiting, there is a selective advantage for certain
species of cyanobacteria, which have the ability to fix atmospheric N, to
flourish.
The transformation in the
quality of Metro effluent has effected a fundamental change in the lake
ecosystem. A reduced phosphorus supply has resulted in lower algal biomass,
since phosphorus is now firmly established as the limiting nutrient for algal
growth in Onondaga
Lake. Reduced algal
biomass results in less organic material to be decomposed in the lower waters,
and a reduced demand on hypolimnetic oxygen resources. The result is a decrease in
volume-days of anoxia and increased dissolved oxygen levels during fall mixing
(Figure 4-11). The oxidation of ammonia
to nitrate in Metro’s biological treatment system has resulted in a statistically significant increase in
nitrate concentrations in the lake’s upper and lower waters. The increased nitrogen
concentrations are also a consequence of the lower phosphorus loading. As
phosphorus and algal productivity have declined, there is diminished uptake of
all forms of nitrogen from the water column.
The presence of nitrate in
the lower waters has affected the redox status of the lower waters, and modified the dynamics of
sediment phosphorus release. As oxygen is depleted from the deep waters,
nitrate serves as an alternate electron acceptor for the microorganisms
actively decomposing organic material settling out of the photic zone. As long as nitrate is present, reduction of iron and
manganese is prevented, and phosphorus bound to these minerals remains trapped
in the lake sediments (Figure 4-12).
Comparing the 2009 results to
those of previous
years highlights the effect the increasing nitrate levels have had
on the redox status of the lake’s hypolimnion, as reflected in the diminished
accumulation of SRP in the lower waters during the summer period of thermal
stratification.
Once iron and manganese are reduced,
phosphorus is released to the overlying waters and the SRP concentrations in
the hypolimnion increase. If the phosphorus released to the upper waters
includes more than that represented by decomposition of algae from the current
year, it may be considered as an internal load (recycle). An estimate of the mass of phosphorus released from the lake sediments during
the stratified period each year indicates that there is a great deal of
variability; some change may be a result of improving redox status of the
hypolimnion. However, variations in algal production and
the duration of stratification also affect the magnitude of the internal
phosphorus recycling.
4.5 Seneca River
The ACJ includes
provisions for monitoring and modeling the water quality conditions in the Seneca River
as part of a regional approach to wastewater management. The Seneca River
is included on New York
State’s compendium
of impaired waters, due to low
dissolved oxygen concentrations during warm water and low flow conditions. The outlet of Onondaga
Lake joins the Seneca
River as it flows north to Lake Ontario;
the chemistry of Onondaga
Lake waters clearly
affects water quality of the river in the vicinity of the outlet. As part of the annual AMP, water quality
conditions are monitored at Buoy 316 in the Seneca River during
summer low flow conditions (Figure 4-13); data are collected from other buoy
locations to support the Three Rivers Water Quality Model. Results of
the 2009 program are reported in the
library.
Between
June and October, 2009, water-quality recording devices (YSI sondes) were deployed at Buoys 316, 236 and 409 to measure in-situ
dissolved oxygen, pH, salinity and temperature at 15-minute intervals. Two
sondes are placed at each location, one in upper waters and one in lower
waters. These locations document ambient
water quality conditions upstream of the “state cut”, an area of prolific dreissenid
mussels (Buoy 409), upstream of the Baldwinsville-Seneca Knolls WWTP outfall
and outlet of Onondaga Lake (Buoy 316), and downstream of the lake outlet and
Wetzel Rd WWTP outfall (Buoy 236).
In addition to the
high-frequency sonde monitoring, three full water quality surveys were
conducted in 2009 on July 9th (discharge 3350 cfs), August 12th
(discharge 5090 cfs) and September 24th (discharge 783 cfs). Three additional surveys were conducted only
at Buoy 316 on July 30th (discharge 733 cfs), August 27th
(discharge 830 cfs) and September 16th (discharge 729 cfs). Note
that all the discharge data are considered provisional as of the date of this
report. Taken together, these data
portray water quality conditions in the Seneca River
in response to point source discharges, biological conditions and changes in
quality of the outflow. The water quality data collected in 2009 during the
three full river surveys were generally similar to data collected in previous
years. The data measured during the individual
surveys were reflective of the predominant processes occurring in the river at
that time of the year, including flow conditions, dreissenid mussel activities,
and inflow from Onondaga Lake and subsequent mixing.
The higher
salinity of Onondaga Lake waters compared to the Seneca River
affects stratification and mixing of the outflow. Particularly when flow and
velocity in the Seneca River are low, the more saline, denser water entering
from Onondaga Lake forms a discrete lower water layer that is detectable at
nearby locations. The salinity data collected during the September 2009 survey, when the river flow was relatively
low, indicated stratification occurred downstream of the Onondaga Lake
outlet. The high salinity concentration observed in the bottom water
between Buoy-269 and Buoy-240 was likely a result of mixing with more saline
and denser water entering from Onondaga
Lake, as well as the
localized groundwater discharge at the “deep hole” area. There was no
stratification observed at Buoy-296 during the September 2009 survey, which
indicated the lake water has little influence to Seneca
River upstream of the Onondaga Lake outlet during that survey.
The Onondaga Lake
outlet is not the only factor affecting water quality of the Seneca River.
In the early 1990s, the invasive dreissenid mussels (zebra and quagga mussels)
began to colonize sections of the Seneca
River as they migrated eastward from
the Great Lakes through the NYS
Barge Canal
system. Proliferation of the mussels
along the river bed has profoundly affected the cycling of nutrients and
organic material, and, consequently, the quality of the river water. Respiration of the benthic organisms depletes
dissolved oxygen, and the river water has become notably clearer as
phytoplankton and other particles are filtered out. Greater light penetration
has allowed macrophyte growth to expand.
Results of the Seneca River
monitoring program support an evaluation of compliance with ambient water
quality standards and the development, verification and validation phases of
the integrated TRWQM and OLWQM modeling initiatives.
Validation of the lake and river models is underway using AMP data from 2004 – 2007.
The average river
flows during the summer of 2009 were comparable to long-term average summer
conditions, and did not approach low flows.
Compared with the previous two years, the 2009 summer flow conditions
were more variable, with flows ranging between 2,000 and 6,000 cfs. There were
some periods at the beginning of August and during September when river flows
declined; however, these periods were of relatively short duration. The average summer flow rate in 2009 was
approximately 1,600 cfs, comparable to the long-term summer average of 1,700
cfs. As a reference, the seven-day average low flow condition for the Seneca River
at the Baldwinsville monitoring site with a probability of recurring once in 10
years (the 7Q10 flow) is approximately 350 cfs. This figure is based on 55
years of record.
In 2009, there were
just two individual days with flows falling below the 7Q10 threshold; water
quality sampling did not occur on either day. Most significant to water quality
and habitat conditions, 2009 streamflow was sufficient to prevent prolonged
periods of low DO. As a result, the
spatial trends of water quality parameters during the July and August surveys
were similar in top and bottom waters and were overall less pronounced than
those typically observed under lower flow conditions. Spatial trends observed during the September
survey indicated stratified flow conditions and were consistent with trends
observed during low flow surveys conducted in previous years. Notably, the water quality
conditions in 2009 exhibited an improvement with respect to regulatory compliance as compared to conditions
measured during 2007 with a comparable flow regime.

5.
Biology and Food Web: 2009
Results and Trends
This section of the annual report
reviews the extensive data describing the phytoplankton, macrophyte, zooplankton, dreissenid mussel and fish communities that comprise the Onondaga Lake food
web. As phosphorus concentrations in Onondaga
Lake have declined to
mesotrophic levels, biological conditions have responded. Improved light penetration, a consequence of
lower algal abundance, has led to expansion of macrophyte beds in the littoral
zone; the macrophytes provide improved habitat and shelter for fish and other
aquatic organisms. The decline in
alewife abundance, which dominated the fish community between 2003 and 2006,
has led to increasing diversity in the fish community.
5.1 Phytoplankton
Although phytoplankton abundance
in 2009 was higher than measured in
2008, the average algal biomass for April-October remained well below that
expected for a meso-eutrophic lake (3-5 mg/L, Wetzel 2001) and is similar to
that of 2007, at 1.2 mg/L (Figure 5-1). Peak algal biomass did not exceed
3.5 mg/L in 2009, confirming the lake’s mesotrophic status. Over the last
decade, phytoplankton biomass has declined significantly, and 2007, 2008 and
2009 were the three lowest years on record. This decline is likely due both to
the improved removal of phosphorus from the Metro effluent and to increased
grazing by dreissenid mussels.
Diatoms continued to
dominate the phytoplankton community, but the seasonal pattern of succession of
phytoplankton taxa was different in 2009 from that of 2008. In 2009, as in 2008, there was a spring bloom
of diatoms, ending in mid-June. Unlike
2008, however, algal biomass, led by diatoms and dinoflagellates, showed a
sharp peak of abundance in July (Figure 5-2 and Figure 5-3). A minor algal bloom (peak chlorophyll-a
concentration less than 10 ug/L) in October and November of 2009 was dominated
by chrysophytes; this taxonomic group was not an important component of the
phytoplankton community in the fall of 2008.
The pattern of
phytoplankton abundance in 2009 reflects food web dynamics, especially the
interactions of alewife and zooplankton. The alewife population was down in 2009,
which effectively released larger zooplankters, including Daphnia mendotae, from predation by this fish. In response,
relatively large zooplankton were abundant. However, after a brief clear-water
phase in late June 2009, the daphnids were eventually replaced by smaller Bosmina longirostris, a species that is
far less effective grazing on the phytoplankton. This allowed the midsummer resurgence of a
phytoplankton community dominated by diatoms, which was not evident in 2008. The decline of diatoms in late July and early
August 2009 may have been caused by silica depletion. The hard, porous cell wall of diatoms is
made almost entirely of silica, and diatom abundance can be limited by the
availability of this element. The
alternating peaks and valleys of silica concentration and diatom abundance seen
in 2009 (Figure 5-4) support this interpretation. As in 2008, a bloom of diatoms appears in the
late fall, perhaps enabled by the return of silica to the upper waters with
lake turnover. A non-native species of
diatom not previously recorded in Onondaga
Lake (Actinocyclus normanii), was the most
abundant phytoplankton species in 2009 and dominated the fall diatom
bloom. Although this diatom likely
originated in the marine and estuarine environment off the coast of Norway and
Germany and in the Baltic Sea, it has successfully adapted to life in fresh
waters, particularly those with an abundant nutrient supply (USGS Nonindigenous
Aquatic Species Fact Sheet http://nas.er.usgs.gov/queries/FactSheet.aspx?speciesID=1695). This taxon is considered to be
an invading species in the Laurentian Great Lakes (Mills et al. 1993), likely
arriving in Lake Ontario in 1938 in ballast water, based
on analysis of sediment cores. Actinocyclus normanii is also documented present in
Lake Michigan, Lake Erie, and Lake Huron, and has been reported in Lake Superior. The Onondaga
Lake phytoplankton historical
data document that the spring
diatom bloom has been typical of spring conditions, and that the silica
concentrations in the upper waters are depleted as the bloom develops. However, until recently, diatoms did not
exhibit the secondary peak in abundance in the fall.
Cyanobacteria and dinoflagellates, which dominated the
phytoplankton community in Onondaga Lake until 2001, have now nearly
disappeared from the lake, and nuisance blooms of Aphanizomenon (A. gracile
and A. flos-aquae), typical of
summers before 2000, no longer occur.
The species of cyanobacteria remaining in the lake are smaller in size,
and peak Cyanobacteria abundance reached only 0.03 mg/L in
2009.
5.2 Macrophytes
The macrophyte community continued its expansion within the lake’s
littoral zone in 2009. Based on annual aerial photographs, coverage has
expanded from 85 acres in 2000 to 382 acres in 2009. Extensive surveys are
conducted every five years (2000, 2005 and 2010) to complete a species
list and document changes in
biomass. The AMP team completes limited field surveys of the macrophyte
community the week of the aerial flights; this field program is used to verify
the estimates of relative abundance and assess the species composition. In
2009, the most abundant species were submersed macrophytes (Table 5-1).
Table 5-1. 2009 Macrophyte Field
Survey Results.
|
|
|
|
Where Present
|
Overall
|
|
Species
|
Percent of
Sites
|
Relative
Abundance
|
Relative
Abundance
|
|
Coontail (Ceratophyllum
demersum)
|
90%
|
30%
|
27%
|
|
Common water weed (Elodea
canadensis)
|
90%
|
28%
|
25%
|
|
Eurasian water milfoil (Myriophyllum
spicatum)
|
80%
|
18%
|
15%
|
|
Southern naiad (Najas
quadalupensis)
|
60%
|
23%
|
14%
|
|
Water stargrass (Zosterella
dubia)
|
50%
|
40%
|
20%
|
|
Curly leaf pondweed (Potamogeton
crispus)
|
40%
|
<1%
|
<1%
|
|
Small pondweed (Potamogeton
pusillus)
|
10%
|
<1%
|
<1%
|
5.3 Zooplankton
The zooplankton
community is a pivotal component of the lake ecosystem; these grazing aquatic
animals affect the abundance and species composition of the phytoplankton
community, and are, in turn affected by the fish community. The size structure
and abundance of the Onondaga
Lake zooplankton
community is tracked annually as part of the AMP. In Onondaga Lake,
the zooplankton and benthic mussels are the most important grazers of
phytoplankton; larger zooplankton are far more efficient grazers and the
presence of larger organisms results in less algae and clearer waters. The size structure of the zooplankton
community, i.e., the relative abundance of small and large species, is a
consequence of the grazing pressure exerted on zooplankton by fish.
The average
biomass of all zooplankton in the lake (as measured in dry weight) was slightly
lower during April-October 2009 (236 µg/L) than it was for the same period in
2008. The peak zooplankton biomass,
evident in mid-June 2009, was 740 µg/L. During this period of peak abundance,
the zooplankton community was dominated by taxa in the family Bosminidae, which are small crustacean
species.
The average size of zooplankters from April to
October 2009 (0.43 mm) was larger than during the years 2003-2005 (0.32-0.34
mm), years of peak abundance of alewives (Alosa
pseudoharengus), the dominant fish planktivore (Figure
5-7). In 2009, as in 2008, larger
species of Daphnia make up a
significant part of the zooplankton community (Figure 5-5). The resurgence of daphnids (Figure 5-6) and
the large average size of zooplankters in the summer of 2008 and 2009 (Figure
5-8) reflect the decline in alewife abundance in these years. However, the zooplankton data from 2009
suggest that the alewife population may be rebounding in the lake. In 2009, the
average size of the zooplankton community decreased again in August (Figure
5-8). This decline is most likely a
result of a strong year class of alewife and gizzard shad, and the associated
high rates of predation on the larger zooplankton. Overall, the size structure
of the Onondaga Lake zooplankton community is consistent
with relatively high levels of herbivory by the fish community. According to
Dr. Edward Mills, a member of the Onondaga Lake Technical Advisory Committee,
the dominance of Daphnia mendotae in
the zooplankton community suggests that zooplanktivory is reasonably intense in
Onondaga Lake and that fish species like gizzard
shad and white perch, in addition to alewife, may have an impact. The ultimate indication of low zooplanktivory
in Onondaga Lake would be dominance of the very
large Daphnia pulicaria.
5.4 Zebra and quagga mussels
The density of dreissenid mussels declined
slightly in 2009, although the biomass increased (Figure 5-9), reflecting a
shift in dominance from smaller zebra mussels (Dreissena polymorpha) to larger quagga mussels (Dreissena bugensis) (Figure 5-10). Since mussels are known to act together with
lowered nutrient loading to keep phytoplankton biomass low (Idrisi et al. 2001,
Zhu et al. 2006), water clarity in Onondaga Lake should continue to increase
with continued reductions in phosphorus loading and continued expansion of the
dreissenid mussels.
5.5 Fish
Changes in the fish community
of Onondaga Lake are anticipated as water quality
and habitat conditions improve. The significant reduction in ammonia and
phosphorus input, and the consequent shift from eutrophic to mesotrophic
conditions are expected to expand available fish habitat within both the
littoral zone and the pelagic zone.
Since 2000, the AMP has included an extensive fisheries monitoring
program, incorporating different types of sampling gear to assess nesting,
larval, juvenile and adult stages of numerous species. The challenge in data
analysis and interpretation lies with the multitude of abiotic and biotic
factors affecting the fish community, including weather and climate,
interactions among species, food web effects and invasive species. This
expanded discussion of the lake’s fish community is based on an analysis of the
first decade of the AMP, a time of significant water quality changes. A technical appendix provides
additional detail. The species
identified in Onondaga
Lake in 2009 are listed
in Table 5-2.
|
Table 5-2. List of Fish Species Identified in Onondaga Lake, 2009.
|
|
Alewife
|
Brown bullhead
|
Golden shiner
|
Quillback
|
Walleye
|
|
Banded killifish
|
Carp
|
Largemouth bass
|
Rock bass
|
White perch
|
|
Black bullhead
|
Chain pickerel
|
Longnose gar
|
Shorthead redhorse
|
White sucker
|
|
Black crappie
|
Channel catfish
|
Northern hog sucker
|
Silver redhorse
|
Yellow bullhead
|
|
Bluegill
|
Freshwater drum
|
Northern pike
|
Smallmouth bass
|
Yellow perch
|
|
Bowfin
|
Gizzard shad
|
Pumpkinseed
|
Tesselated darter
|
|
Richness and Diversity
Several important metrics of
the fish community are based on measured diversity and richness of the adult
fish community, both littoral (near-shore) and pelagic (open water). Richness is a count of the number of species
within a community, while diversity considers both the number of species
present and their relative abundance. In Onondaga Lake,
richness has
generally increased over the decade of AMP monitoring, from 24 species in 2000
to 28 species in 2009. The lake is an open system, with easy migration into and
from connected waterways through the Seneca
River system. Over the last decade, some 45 fish species
have been documented in the lake, comparable to regional waters.
Diversity of the fish community fluctuates
in response to the periodic peaks and crashes of two species of clupeid, the
alewife (Alosa pseudoharengus) and
gizzard shad (Dorosoma cepedianum). Abundance of these two species of the herring
family is highly variable, as Onondaga
Lake is near the northern
edge of their range, and both species periodically exhibit significant winter
mortality. Extremes in recruitment are seen as well; both species periodically
produce very strong year classes that dominate the catch for years, as
individual fish can live 10 years or longer.
Reproductive Success
An assessment
of fish reproduction is conducted by several methods including nesting surveys, sampling
of larval fish, and sampling of young of year (YOY) fish. Evaluation of the young fish provides
information on overall health of the fish community within the lake and success
of reproductive efforts from year to year.
Factors other than water quality, including water temperature during and
after spawning, water levels, and trophic dynamics, can affect reproductive
success and need to be considered.
The
centrarchid species in the lake (largemouth and smallmouth bass, pumpkinseed
and bluegill sunfish, rock bass) and bullhead construct nests in the littoral
zone. Each year, the AMP team conducts nesting surveys to estimate the number
and spatial distribution of the nests.
In 2009, 1,995 nests were observed, with a fairly even distribution
between the north (54%) and south (46%) basins.
This represents a more even distribution; for example, as recently as
2007, 84% of the nests were located in the northern basin. More than half of the nests supported pumpkinseed sunfish.
The
2009 sampling program collected larval stages of alewife, bluegill, gizzard
shad, pumpkinseed, white perch, and yellow perch in Onondaga Lake,
documenting successful reproduction of these species. In addition, the 2009
field effort captured young-of-year (YOY) smallmouth and largemouth bass, brown
and yellow bullhead, common carp, golden shiner, rock bass, shorthead redhorse,
tessellated darter and white sucker. Larval samples were
dominated by the alewife, indicating another strong year class for this clupeid
species. Both the diversity and
richness of YOY have increased over the decade of Onondaga County
biological monitoring, indicating more species reproducing as well as a more
balanced community.
Recreational Fishery
Onondaga Lake
supports a varied recreational fishery, with largemouth bass, smallmouth bass,
bluegill and pumpkinseed (Lepomis or
sunfish species), yellow perch and brown bullhead some of the more common sport
fish present. Population characteristics
of these species were investigated to assess changes in the quality of the
sport fishery. Specifically, the
relative abundance of fish in various size classes available to anglers was
evaluated along with general condition with regard to weight of fish of each
species across a range of size classes. Angler diaries summarize
catch rates for largemouth and smallmouth bass by anglers over time and compare
rates to other waters.
Analysis
of largemouth bass catch data indicates the size distribution of this
species is skewed notably toward fish 8-15 inches (203-381 mm) in length,
providing anglers with a consistently large proportion (~70%) of catchable-size
largemouth bass of small to moderate length and a more variable proportion of
fish of relatively large size. Fish
exceeding 20 inches (508 mm) have been collected infrequently during AMP
sampling efforts. This suggests that
fish of this size are rare in Onondaga
Lake or are not
susceptible to capture by the sampling gear used. Analysis
of largemouth bass weight by size class
indicates that fish are relatively heavy for their length; suggesting that
forage is not limiting.
In contrast,
smallmouth bass in Onondaga
Lake are not as heavy
relative to their length as are largemouth bass. The Wr values for
smallmouth are <100, but they are not unusually low compared with regional
lakes. The lower relative weight likely reflects more limited forage for
smallmouth bass (either due to competition or limited production of preferred
forage). The preferred forage of adult smallmouth bass is crayfish; these
benthic crustaceans are not abundant in Onondaga Lake.
Size distribution of smallmouth bass
in the catch has shown a distinctly different pattern than that of largemouth
bass and indicates that recent catches are dominated by fish of small size
(less than 11 inches). Since 2007, fish
less than 11 inches have comprised approximately 90% of collected smallmouth
bass; fish of this size comprised only 33-60% of the smallmouth bass in
2000-2004. The increase in the
proportion of smaller smallmouth bass collected is due in part to an overall
increase in the numbers of fish of this size, but also reflects declining
numbers in larger size categories.
However, this increase is considered to be a sampling artifact arising
from a habitat shift. Improving
water-quality conditions in the lake’s pelagic zone has made such
areas more habitable for smallmouth bass.
Larger smallmouth bass may also have shifted their habitat use to
off-shore areas due to increased water clarity, increased vegetative cover in
the littoral zone, and to take advantage of the abundant alewife as a forage
base. Smallmouth bass occupying deeper, offshore habitats would be relatively
unsusceptible to capture by the AMP sampling methods.
The analysis of sunfish catch
indicates that the population is dominated by fish of 3-8 inches in length.
Catch results suggest that sunfish production was poor in 2004 and 2005 but has
increased since then, with relatively high numbers of fish of 3-8 inches
available to anglers in 2008 and 2009.
The poor production of bluegill and pumpkinseed in 2004 and 2005 may
have been due to alewife predation on sunfish larvae. Alewife abundance has declined since 2005,
which may have allowed for the recent production of stronger sunfish year
classes.
Sunfish greater than 8 inches in the
catch have been scarce; several factors may be contributing. It is possible that larger sunfish are not
being captured in proportion to their abundance by the gear being used. Larger adult sunfish – at least bluegill -
tend to be more pelagic than juveniles and smaller adults and may be captured
disproportionately less than these other groups when electrofishing littoral
habitats. Slow growth of fish after
reaching reproductive age may also be contributing to low abundance of larger
sunfish in Onondaga
Lake. Weight
analysis of adult-size fish indicates that forage is not limiting for sunfish
in Onondaga Lake
and energy reserves of individual fish are relatively high, so it is possible
that this energy is being put into reproductive effort rather than body
growth. Despite the scarcity of
sunfish greater 8 inches, sunfish up to that size are readily available to
anglers and are increasing in abundance in recent years.
Size distribution of yellow perch in
the catch indicates that the population is dominated by fish 5-10 inches
long. There have been occasional
increases in the proportion of fish 10-12 inches long. From an angling perspective, the yellow perch
fishery of Onondaga
Lake is somewhat cyclic
in nature due to fluctuations in year class success. The overall abundance of
yellow perch has been increasing, and number of fish longer than 10 inches is
also increasing. This translates to more
and larger yellow perch available to anglers.
Analysis of the size distribution of
the brown bullhead catch indicates that a relatively high proportion of
catchable-size fish greater than 9 inches long, with just over 50% of
catchable-size fish greater than 12 inches in 2009. This affords anglers an
opportunity to catch relatively large brown bullhead. Overall numbers of brown bullhead have been
increasing in recent years, suggesting that a high-quality brown bullhead
fishery is becoming established in Onondaga
Lake. Analysis of brown bullhead weight for various
size classes indicated that brown bullhead
in Onondaga Lake are in generally good condition, but not particularly heavy
for their length.
Abnormalities
The
occurrence of physical abnormalities in fish captured during AMP sampling is
monitored using a standardized protocol known as DELTFM. DELTFM abnormalities are defined as Deformities,
Erosions, Lesions, Tumors, Fungus, and/or Malignancies. Data are used for trend analysis and to
compare fish collected from Onondaga
Lake to those collected
in other areas. Fish abnormalities can
result from chemical contamination; biological agents such as bacteria, viruses
or fungi; or interactions among multiple stressors.
DELTFM
abnormalities have increased in recent
years. DELTFM abnormalities were found in 1.6% or less of adult fish from
Onondaga Lake from 2000 to 2004, increased to 3.2% in 2005, decreased slightly
to 2.6% in 2006, and then increased steadily to 5.1% in 2009 (Figure 5-11). The overall increase appears to be primarily
related to increases in deformities (including injuries) and lesions (likely
bacterial, fungal, or viral infections).
The species
contributing the most to the DELTFM total in 2009 were brown bullhead (48% of
total), white sucker (12%), gizzard shad (9%), pumpkinseed (8%), and largemouth
bass (7%). Of the fish species found
with abnormalities, the percentage of adults collected with DELTFM
abnormalities was greatest for those species generally considered benthic or
bottom-oriented. These species include
brown bullhead, white sucker, shorthead redhorse, silver redhorse, channel catfish
and bowfin.
Most of the abnormalities in the lake’s fish community in 2009
were lesions (63%), followed by erosions and deformities (15% each). Tumors, malignancies, and fungal infections
were relatively rare (<6% combined). Brown bullhead has consistently had the highest
incidence of DELTFM abnormalities of any species collected from Onondaga Lake.
The
cause of the overall increase in DELTFM abnormalities since 2003 is not
understood. No individual species that
have consistently exhibited DELTFM abnormalities have shown a similar increase
over time. Some of the observed overall
increase is due to increases in the abundance of individual species over time. As an example, brown bullhead have been
steadily increasing in abundance in the fish community as a whole. Because this species has a relatively high
incidence of DELTFM abnormalities, an increase in the population size of brown
bullhead has resulted in an increase in the total number of DELTFM
abnormalities observed overall. This
reasoning explains a portion of the observed increase, but it does not account
for all of it.
The
percent of fish of a given species with DELTFM abnormalities is highly variable
from year to year; as a consequence, no individual species has demonstrated a
statistically significant increasing trend in DELTFM abnormalities. Notable increases in lake-wide DELTFM
abnormalities have occurred in 2005, 2008, and 2009. In each of these years, different species
have shown marked increases in DELTFM abnormalities from the previous
year. In 2009, one such species was
gizzard shad. DELTFM abnormalities were
found on 24% (21 of 88) of gizzard shad collected in 2009, compared to a
previous high of 0.8% (1 of 123) in 2006.
Similarly, the number of pumpkinseed with DELTFM abnormalities increased
from a high of 5 in 2008 (3.9% of all abnormalities) to 18 in 2009 (8.0% of all
abnormalities). A large increase in the
incidence of DELTFM abnormalities in a species one year may be followed by a
similar decrease the following year. The
inconsistent and sometimes widely fluctuating incidence of DELTFM abnormalities
in individual fish species complicates identification of causes of the apparent
increase in DELTFM abnormalities over time in the lake.
The
types of DELTFM abnormalities affecting fish in Onondaga Lake
has changed over the course of the AMP.
The incidence of deformities and tumors has declined considerably, while
the incidence of lesions has increased significantly. Many factors can influence the incidence of
lesions, including types and abundance of various bacteria and other pathogens
in the lake, physical stress on fish (such as spawning activity, elevated water
temperature, extremes in water chemistry), chemical exposure, and injury or
stress from fish sampling programs and angling.
Further study of the types of injury or infection associated with
observed lesions is required to better understand what causes the observed
lesions, why the incidence of lesions is increasing, and whether the causes are
consistent across species.
The
incidence of lesions and tumors in brown bullhead in Onondaga
Lake from 2000 to 2009 was compared
with similar data from waters in the Chesapeake Bay watershed, Great Lakes, and
Cape Cod area.
Prior to 2007, occurrences of lesions and tumors in Onondaga Lake
brown bullhead were within the range associated with reference sites (typically
<5% incidence) from this larger regional set of waters. Data since 2007 indicate a shift in
occurrence to levels associated with contaminated sites from regional waters. The
cause of this shift is not known, but as indicated previously, several
pathogens affecting brown bullhead in Onondaga Lake
have recently been identified. The
incidence of lesions and tumors in brown bullhead in Onondaga Lake
declined in 2009, reflecting an apparent recovery (at least partially) of the
population from these pathogens. Another
possible explanation for the observed increase in DELTFM abnormalities in
recent years is that as water quality has improved over time, more of the lake
area has become inhabitable for fish. As
a consequence, benthic fish may be expanding their use of areas with
contaminated sediments. Increased
exposure to contaminated sediment could be causing an increase in DELTFM
abnormalities in benthic species.

6. 6. Integrated Assessment of the Food Web
The improvement in the trophic status of Onondaga Lake
over the last decade, following upgrades to the Metro wastewater treatment
facility, is remarkable. From eutrophic
conditions throughout the 20th century, with frequent blooms of
nuisance cyanobacteria and episodes of upper water anoxia, Onondaga Lake
has now reached a state of mesotrophy similar to many other lakes of this region without histories of
pollution. Algal blooms have diminished and water clarity has improved. Rooted aquatic plants have returned to the
littoral zone, providing expanded nearshore habitat for fish and other aquatic
animals. In addition, the improved water
clarity, coupled with improved oxygen conditions throughout the summer, has
created expanded habitat for fish species in pelagic areas.
Furthermore, the long-term
monitoring required by the ACJ has allowed scientists to document the details
of this transition and to integrate the importance of food-web dynamics. At first glance, the story seems simple: nutrient
loading from Metro has been greatly curtailed, and excessive biological
production in the lake has declined as a consequence. But the story is more complex, as events not
directly related to this “bottom-up”
effect have interacted in a synergistic manner to affect the biological
community of Onondaga
Lake.
The major decrease (more than 90%)
in ammonia loading from Metro allowed two keystone species to expand
successfully in the lake--the alewife and zebra mussels. A “keystone species”
is one that exerts a large influence on the structure of an ecological
community, despite its relatively small abundance. Both alewife and zebra mussels have had a
major impact on food web dynamics in Onondaga
Lake. The invasion of the lake by dreissenid
mussels (zebra and quagga mussels)—important grazers on phytoplankton—has acted
together with decreased nutrient loading to reduce phytoplankton abundance. Meanwhile, the explosion of alewives in the lake between 2003 and 2007 also led to “top-down”
changes in the food chain, but of opposite effect, as these voracious grazers on the zooplankton
released the phytoplankton from their consumers and led to increased algal
production. The decrease in alewife
abundance in 2008 and 2009 has allowed the return of larger species of
zooplankton and had subsequent effects on the structure of the phytoplankton
community. These changes have reverberated through the lake’s entire
food web, including the rest of the fish community.
Alewife, while exerting strong
predation pressure on zooplankton (as well as on pelagic larval fish), also
serve as prey for larger fish. The presence
of this pelagic prey, in conjunction with improved quality of the deep water,
increased macrophyte abundance in the littoral zone, and improved water clarity
may have contributed to a shift by larger smallmouth bass and yellow perch
toward a more pelagic habitat. These food-web effects on water clarity are
illustrated in Figure 6-1.
Not all of the effects of improved
water quality may be beneficial to the fish community. Expansion of areas used by bottom-dwelling
species may be a cause of increased DELTFM abnormalities as these species
increase use of areas with contaminated sediments. This could explain the increasing incidence
of DELTFM abnormalities in recent years.
Macrophyte coverage and abundance in
Onondaga Lake has been increasing in response to
water-quality improvements, particularly those resulting in increased water
clarity. This has had significant
ramifications for the fish community.
Several fish species often associated with aquatic macrophytes during
one or more life-history stages have shown significant increases in
abundance. Most of these species are
dependent on macroinvertebrate forage as juveniles and adults or prey on forage
fish dependent on vegetated habitats.
Some of these species also use aquatic macrophytes as a primary spawning
substrate.
In years of high alewife abundance,
fish with pelagic larvae (such as pumpkinseed, bluegill, yellow perch and white
perch) have shown reduced recruitment, which is likely due to predation of
larvae by alewife when alewife abundance is relatively high. Alewives, in turn, serve as forage for
larger, fish-eating species, including smallmouth and largemouth bass, yellow
perch, white perch and walleye. Changes
in the size distribution of smallmouth bass - in particular since 2000 -
suggest that larger adults of this species may have shifted to deeper, offshore
habitat from shallower, littoral habitat.
The availability of alewife as forage in pelagic habitats may be
facilitating this shift. If such a shift
has occurred, this would reflect a change in adult smallmouth bass foraging
from a littoral-based food web to a pelagic-based food web.
Increased macrophyte abundance
presumably has resulted in a substantial increase in production of
macroinvertebrates in the littoral zone.
This in turn promotes the observed increase in abundance of several
littoral fish species that use macrophyte beds for foraging areas. These would include largemouth bass,
pumpkinseed, yellow perch, and brown bullhead among others. Young-of-the-year sport fish and forage fish
species, such as golden shiner, that prefer vegetated habitats are increasing
in number as a result of expanded habitat.
These small fish, in turn, provide additional forage for larger
fish-eating species such as largemouth bass.
The proliferation of zebra and
quagga mussels in the lake after reductions in ammonia levels may be helping to
support the increased abundance of species like pumpkinseed by providing an abundant
food source. Other species like
freshwater drum, yellow perch and common carp that are known to feed on mussels
are also likely benefitting from the increasing abundance of these mussels. Consumption of mussels by multiple fish
species provides another connection between the littoral-based food web and the
pelagic-based food web. The increasing
complexity of the overall food web in Onondaga Lake
is an important sign that the lake is recovering from past environmental
perturbations.
Overall, there has been an increase
in the quantity and quality of habitat available to fish species in Onondaga Lake.
This has resulted in a slight increase in fish species richness with a
more even distribution of fish throughout the lake. Many fish species, particularly those
associated with vegetated habitats, are also increasing in abundance. The aquatic food web within the lake
continues to diversify, with more species becoming more interrelated. This increasing complexity with regard to
energy sources and energy flow results in an ecosystem that may be more
resilient to environmental stress. The
2009 AMP findings indicate that this is an ongoing process and that more
changes are likely to occur. As water
quality continues to improve, and more diverse and higher quality habitats
become established, further increases in aquatic species diversity, abundance
and interrelatedness are expected.

7. Progress with
Related Initiatives
Onondaga Lake is the
focus of several on-going initiatives in addition to the major improvements to
the wastewater collection and treatment infrastructure. The Onondaga Lake Partnership (OLP) was created in 1999 to
coordinate the environmental revitalization, conservation, and management of Onondaga Lake. Members of the OLP are drawn from six agencies,
the U.S. Army Corps of Engineers, Environmental Protection Agency, NYSDEC, the
NYS Attorney General’s Office, Onondaga
County, and the City of Syracuse. Other community groups and volunteers
participate through two standing committees.
The OLP website www.onlakepartners.org summarizes ongoing efforts.
Honeywell International, Inc., is proceeding with
remediation of legacy industrial pollution under regulatory oversight. To date,
efforts have focused on identification and removal of sources to prevent
additional contamination from reaching the lake. Now, the remedial project
effort is addressing contaminated lake sediments. Plans for sediment dredging
and capping in certain areas, mostly in the southern littoral zone, are under
review. Information on the Honeywell project submittals is available online at www.dec.ny.gov/chemical/37558.html on the NYSDEC website.
The Onondaga Lake Basin
Model will be used to analyze the effects that proposed BMPs in the tributary
subwatersheds are likely to have on the loads of phosphorus and nitrogen
entering the lake. These BMPs will include both actions on the landscape (for
example, guiding land use changes) and actions to manage hydrology (for
example, through detention and storage). The link to reports of the Onondaga
Lake Basin Model is http://ny.cf.er.usgs.gov/nyprojectsearch/projects/2457-AF3-1.html.
Onondaga
County Department of Water Environment Protection and the Onondaga
Environmental Institute (OEI) www.onondagaenvironmentalinstitute.org are collaborating on an extensive monitoring and
surveillance program designed to identify and, ultimately, remediate dry
weather sources of bacteria to the lower reaches of Onondaga Creek and Harbor
Brook. Two phases of the investigation have now been completed, with multiple
rounds of sampling during dry weather.
Samples were collected from seven sites along a five mile segment of
Harbor Brook, and 22 sites along a 24-mile segment of Onondaga Creek. Results
have pinpointed specific areas where bacteria are entering the creeks, and
helped direct remedial work on the aging wastewater collection infrastructure
within the City of Syracuse.
A conceptual design and plan for revitalization of
Onondaga Creek
has been
developed by representatives of the City of Syracuse, Onondaga Environmental
Institute, Cornell Cooperative Extension of Onondaga County, Atlantic States
Legal Foundation, the SUNY College of Environmental Science and Forestry, and
Canopy, a coalition of parks associations and community gardens in the City of
Syracuse. Project information is posted
at www.esf.edu/onondagacreek/project.htm.
Each year, Onondaga County DWEP updates a bibliography of published information on Onondaga Lake.
The engineering improvements to the wastewater collection and treatment
infrastructure continue to be the subject of professional and trade
publications and presentations. In addition, scientists and academics continue
to analyze this unique case study of rehabilitation of a once-degraded lake.
The human health impacts and ecological analysis of the contaminant issues are
also analyzed by academic and agency scientists, public policy specialists,
economists, and engineers. An annual Onondaga Lake Symposium is convened each November by the
Upstate Freshwater Institute to discuss recent findings http://www.upstatefreshwater.org/html/annual_olsf.html.
Exploration of green technology solutions to the challenges
facing Onondaga Lake is underway from multiple
perspectives. In addition to investigating green solutions to urban storm
runoff, the OLP is exploring alternative green technologies for mitigating the Tully Valley
mudboils, a source of sedimentation to Onondaga Creek. Onondaga County’s
“Save the Rain” initiative is an effort to educate
the watershed community on effective measures to reduce runoff from the urban
landscape. Information on porous pavement, tree planting, rain gardens, rain
barrels and more are available at http://www.ongov.net/savetherain/index.html.
As efforts continue to reduce point and nonpoint sources of
pollution to the lake, other projects are underway to enhance recreational
access and opportunities for community involvement with the lake and its
shoreline. Planning and design of Phase 1 of the Creekwalk to connect Onondaga Lake
to Armory Square
are complete and construction has begun. Phase 2 of the Creekwalk, connecting
Armory Square to Kirk Park, is under construction

8.
8. Emerging
Issues and Recommendations
From its inception, the Ambient Monitoring Program was designed
for modification in response to new information or changes in regulatory
policy. The fourth stipulation amending the ACJ directed Onondaga County
to, among other actions, enhance the tributary component of the AMP; the
program modifications will begin in 2011. A major objective of the enhanced
program will be to evaluate the effectiveness of the green and gray
infrastructure improvements. The enhanced tributary monitoring will likely
include some testing of CSO-affected streams during storms for the presence and
concentration of priority pollutants, such as heavy metals, pesticides and
other organic compounds. The County will also review its tributary monitoring
efforts to determine whether additional sampling during storms, especially
during the summer, is warranted. In addition, a review of the potential
benefits and costs associated with bacterial source tracking is recommended to
help identify the source or sources of elevated fecal coliform bacteria,
notable in lower Harbor Brook and Ninemile Creek. The Microbial Trackdown Study, which was undertaken as a joint project
of the Onondaga Environmental Institute and OCDWEP, has provided a better
understanding of dry weather discharges into Harbor Brook and Onondaga Creek.
Additional follow-up sampling and investigation has been recommended to
monitor bacteria levels in the streams to gain a greater understanding of the
spatial and temporal dynamics.
This
2009 AMP report includes an examination of the first ten years of data from the
County’s fishery monitoring program. A few minor modifications to the fishery
program design are recommended to address emerging issues and gaps. First, the
significance of observed abnormalities on captured fish merits additional
investigation and documentation. Several research and monitoring efforts to
characterize the fish community are currently underway on behalf of Honeywell
International and the State University of NY College of Environmental Science
and Forestry. Noting likely capture injuries, such as erosion of a dorsal fin,
may help differentiate potential impacts of exposure to sediment contaminants.
Common carp are currently not examined for DELTFM abnormalities, due to the
difficulty of examining these large fish on board the monitoring boat. As
benthic feeders, the condition of carp in the lake may provide useful
information, and it is recommended that a few (2-4) carp be examined in each of
the electrofishing transects. Second,
the County’s design for gill netting (short duration daytime net sets, parallel
to shore) is not optimal; nighttime sets perpendicular to the shore would
likely provide better capture. A side-by-side program is recommended to extend
the utility of the historical data. Third, determining the age of fish captured
would help quantify growth patterns. Onondaga County fisheries biologists have
archived fish scales that could be aged; it is recommended that this effort
proceed.
In
addition to these relatively detailed recommendations related to the fisheries
program, there is an important emerging issue that will affect analysis and
interpretation of all the lake’s biological and habitat data. An extensive
habitat restoration program will be implemented by Honeywell International,
beginning in 2012, to mitigate the impact of legacy pollution and habitat loss.
The plans call for dredging and capping some littoral areas, including regions
of Onondaga Lake monitored for macrophytes, macroinvertebrates and fish as part
of the AMP. Baseline characterization of affected areas is underway by consultants
to Honeywell International. The County anticipates integrating the Honeywell
activities and data into the overall evaluation of the lake’s ecosystem.
As
water quality conditions of Onondaga Lake improve and become comparable to
conditions measured in other waterways, non-indigenous species of zooplankton,
mussels, phytoplankton, fish and macrophytes are able to become established.
Invasive species from the Great Lakes basin are able to reach the lake through
the Seneca/Oneida/Oswego Basin. Analysis of the status of non-indigenous
aquatic species will be included in the 2010 AMP report; results of the 2010
intensive surveys of the macrophyte and littoral macroinvertebrate communities
will inform this analysis.
The Onondaga Lake Water Quality
Model is nearing completion. This important tool was developed and calibrated
using data from the AMP, and has been subject to outside expert peer review.
This model will serve the entire community by defining the water quality and
aquatic habitat benefits, if any, realized by further reducing nutrient and
sediment inputs from point and nonpoint sources.
9. Literature Cited
Callinan, C. E. 2001. Water Quality of the Finger Lakes. NYSDEC, Albany NY.
147 pp.
Carlson, R.E. 1997. A trophic state index for lakes.
Limnology and Oceanography. 22:361-369.
Codd, G.A. 1995. Cyanobacterial toxins: Occurrence,
properties and biological significance. Water Sci. Technol. 32(4):149-156.
Hall, S.R, V. H. Smith, D.A. Lytle and M.A. Leibold. 2005.
Constraints on primary producer N:P stoichiometry along N:P supply ratio
gradients. Ecology. 86(7):1894-1904.
Idrisi, N., E.L. Mills, L. G. Rudstam and D.J. Stewart.
2001. Impact of zebra mussels (Dreissena polymorpha) on the pelagic lower
trophic levels of Oneida Lake, New York. Can. J. Fish. Aquat. Sci. 58(7):
1430–1441
Kishbaugh, S.A. 2009. NY State
Citizens Statewide Lake Assessment Program (CSLAP): Interpretive Summary:
Cazenovia Lake 2008.
Mills, E. L., J. H. Leach, J.
T. Carlton, and C. L. Secor. 1993. Exotic species in the Great Lakes: a history
of biotic crises and anthropogenic introductions. Journal of Great Lakes
Research 19(1):1-54.
Wetzel R. G. 2001. Limnology, Lake and River Ecosystems.
Third Edition. Academic Press NY
Zhu, B., D.G. Fitzgerald, C. M. Mayer, L.G. Rudstam and
E.L. Mills. 2006. Alteration of ecosystem function by zebra mussels in Oneida
Lake: Impacts on submerged macrophytes. Ecosystems 9(6): 1017-1028.